MORNING BRIEF
MACRO, ILLUMINATED.
Treasuries did what they have mostly refused to do since 2022 and hedged a tech rout. Most of the rally came through real yields, with oil higher, so we read Thursday as a growth scare more than an inflation reprieve.
The tape
- Nasdaq 100 QQQ -2.9% Thursday as Meta's nonvoting share plan hit AI names; semis -6.7%.
- Treasuries 10-year -17bps to about 4.96%, the 2-year -16bps; TLT +1.9%.
- Oil Brent futures settled near $113 (+4.0%) after Houthi attacks on Saudi ports; WTI near $101.
- Gold GLD -2.6% on a day both oil and falling real yields argued for a bid.
- Futures S&P -0.3% near 7,683 this morning, VIX 19.6, bitcoin about $81.7k.
This week Tue durable goods, Conf Board · MSFT, GOOGL, AMZN report · Wed FOMC (hold at 3.75-4.00% exp.) · Thu Q3 GDP (3.0% exp.), Sept PCE · Fri Q3 ECI
Papers watch
Bank liquidity regulation and the growth of private credit (BIS WP 1388, Oct 20) Counties with more banks under the liquidity coverage ratio saw nearly 50% more private credit growth after the rule took effect.
When Cash Flows Turn Negative: Liquidity-Driven Selling by Pension Funds (NBER w35896, Oct) Pension funds meet cash-flow shocks mostly by selling stocks: $0.67 of every dollar of shock goes out through equity sales.
Access to Capital and the IPO Decision (NBER w35888, Oct) Firms with bigger external capital needs are more likely to go public, then raise investment and debt with leverage unchanged.
The hedge came backRates
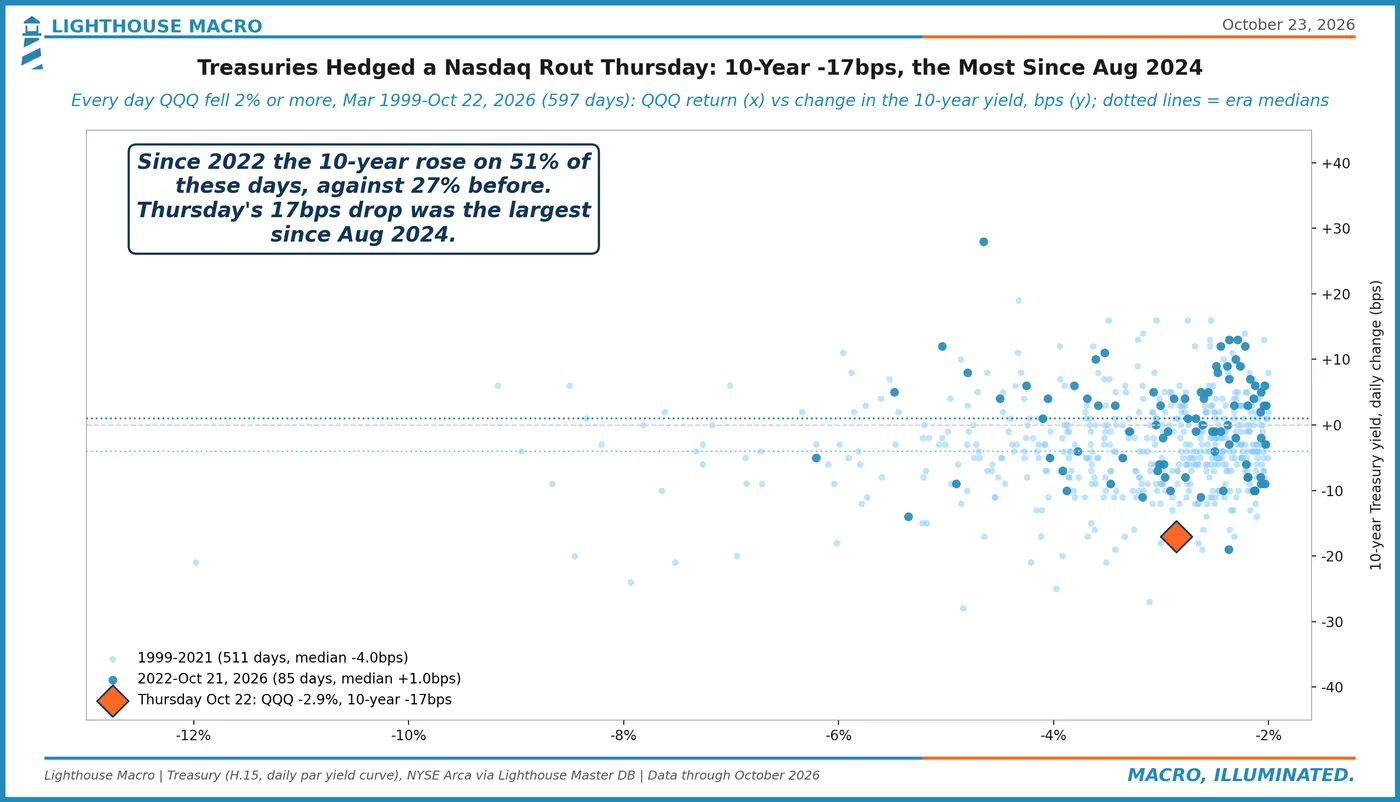
Bonds rallied on a Nasdaq rout, which has been rare lately. Since 2022 the 10-year rose on 51% of 2%+ Nasdaq selloffs. Thursday it fell 17bps, the most on such a day since August 2024.
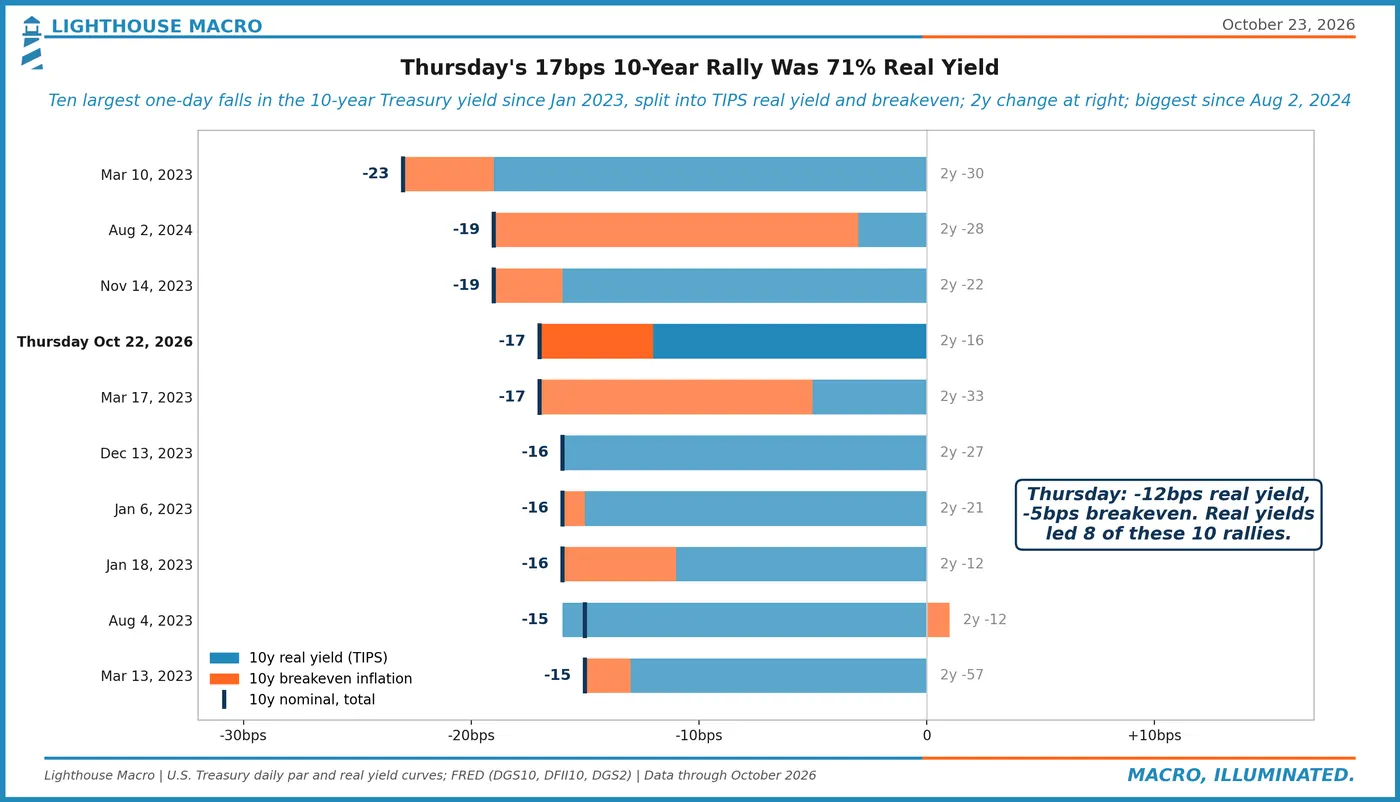
Most of the rally was real yield, not breakevens. Of the 17bps, 12 came from the TIPS yield and 5 from breakevens, with Brent up 4%. That reads more like a growth scare than relief on inflation.
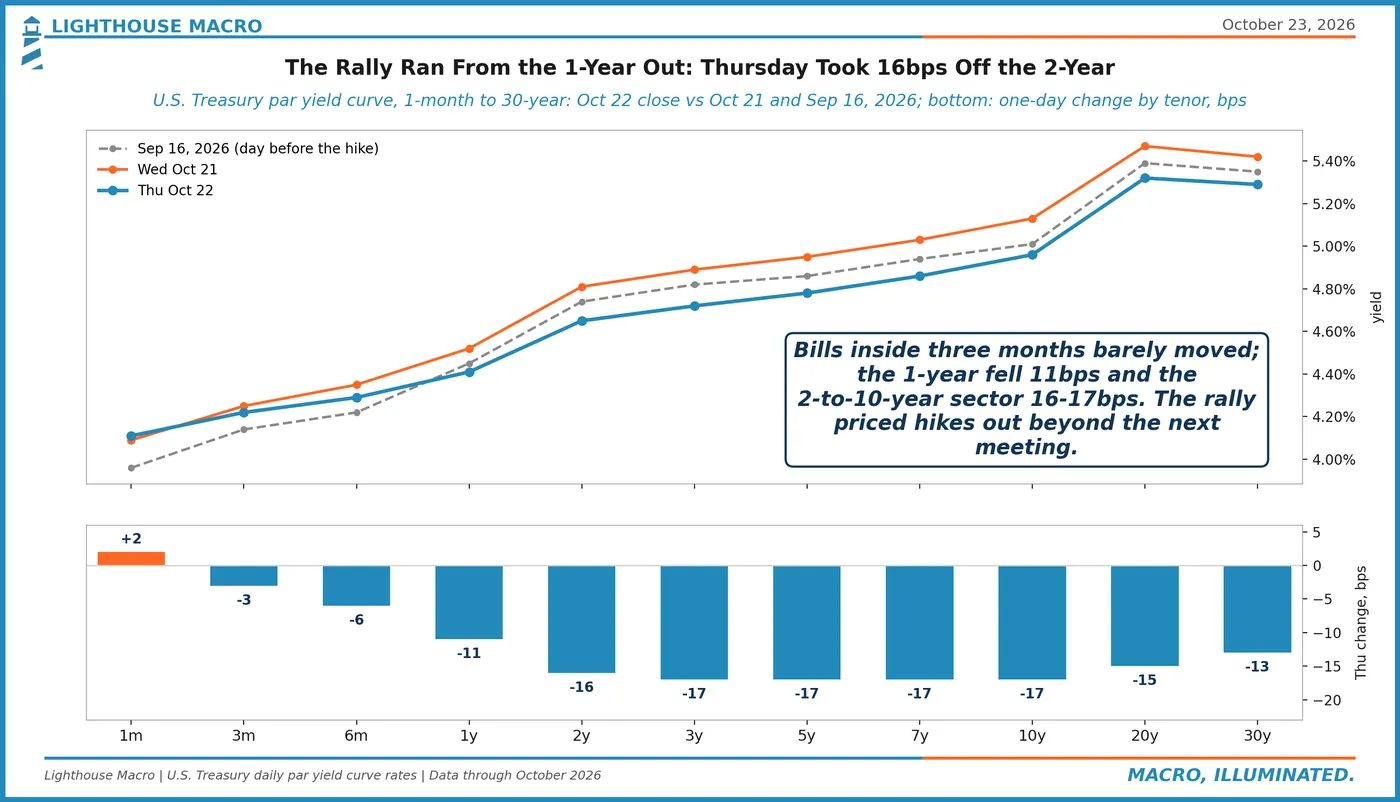
The front end held; the 2-year through the 10-year did not. The 3-month bill moved 3bps while the 2-year fell 16bps. The market took hikes out beyond next week's meeting, not the meeting itself.
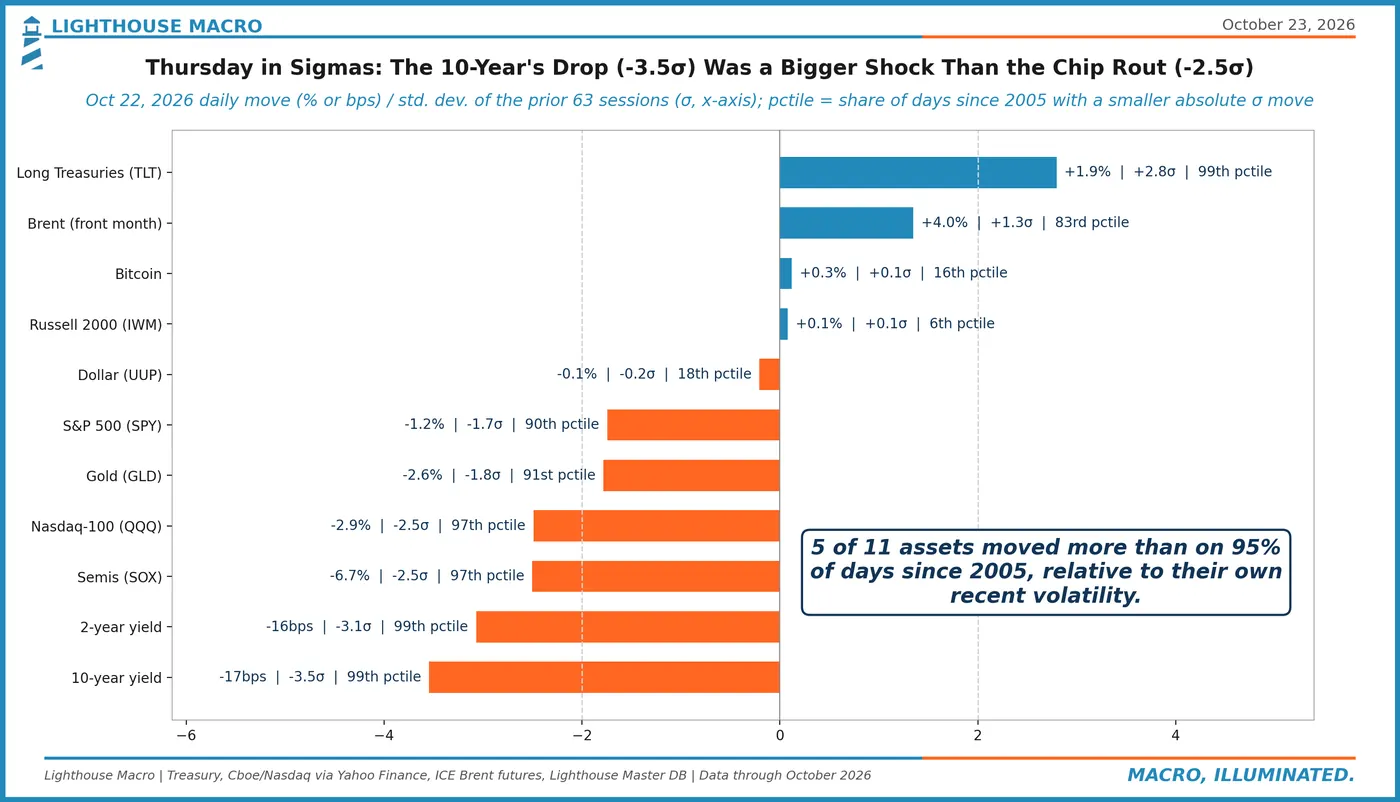
Measured against its own volatility, the bond move was bigger. The 10-year's drop was a 3.5-sigma day against 2.5 for semis. Five of eleven markets moved more than on 95% of days since 2005.
Who funds the build-outBusiness
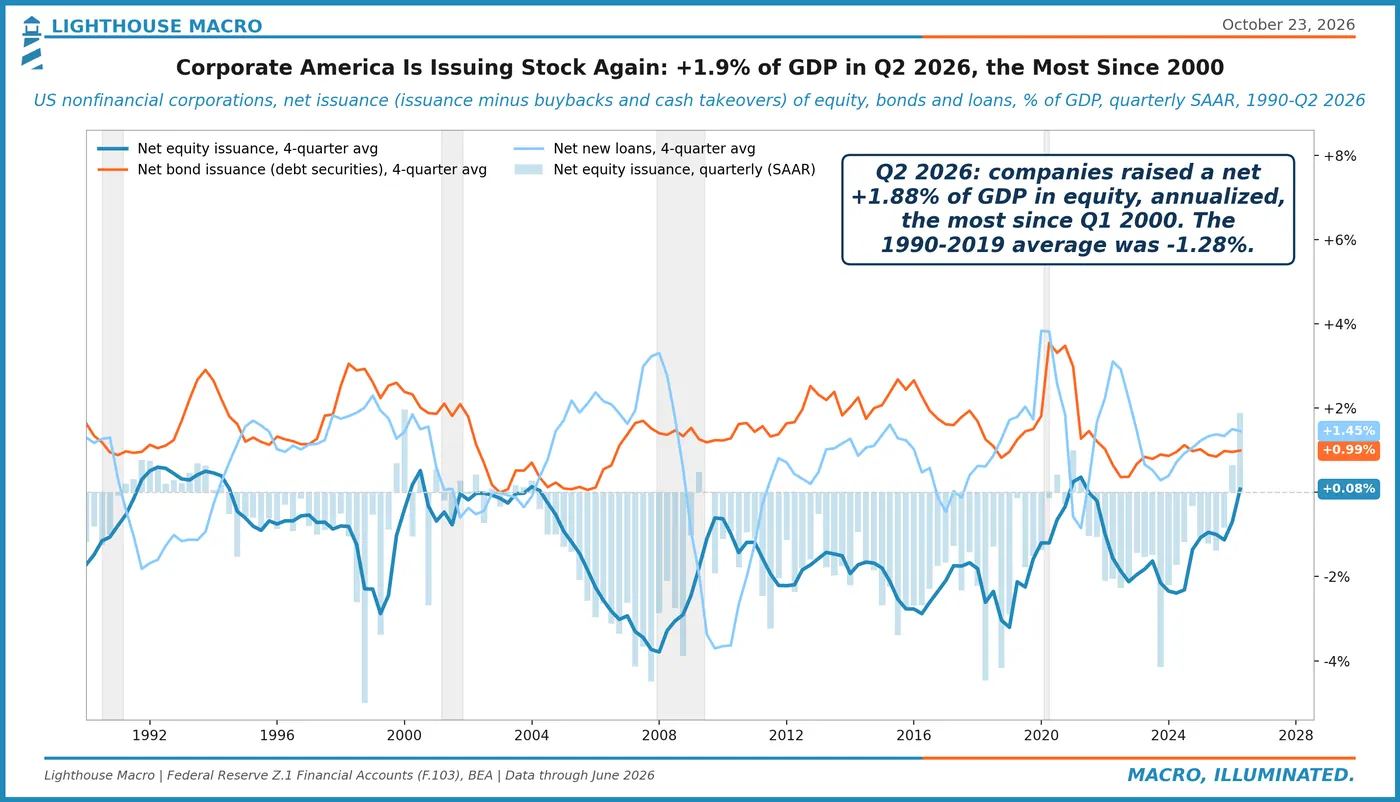
Companies raised the most net stock since 2000. Nonfinancial firms were net equity issuers at 1.88% of GDP in Q2, annualized, against a 1990-2019 average of -1.28% when buybacks ruled.
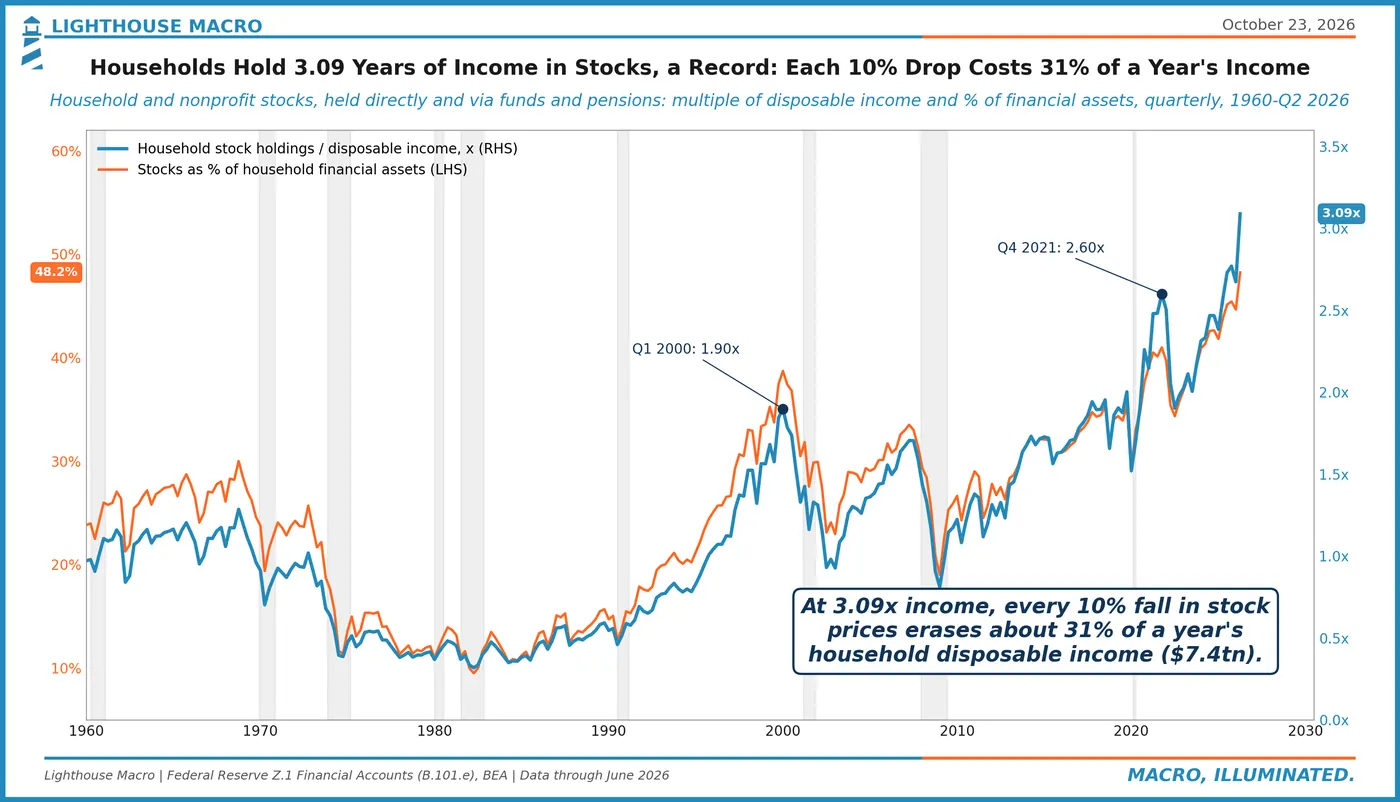
Households have never held this much stock against income. Stocks are 3.09 times disposable income, a record. At that ratio a 10% drawdown takes about 31% of a year's income off household balance sheets.
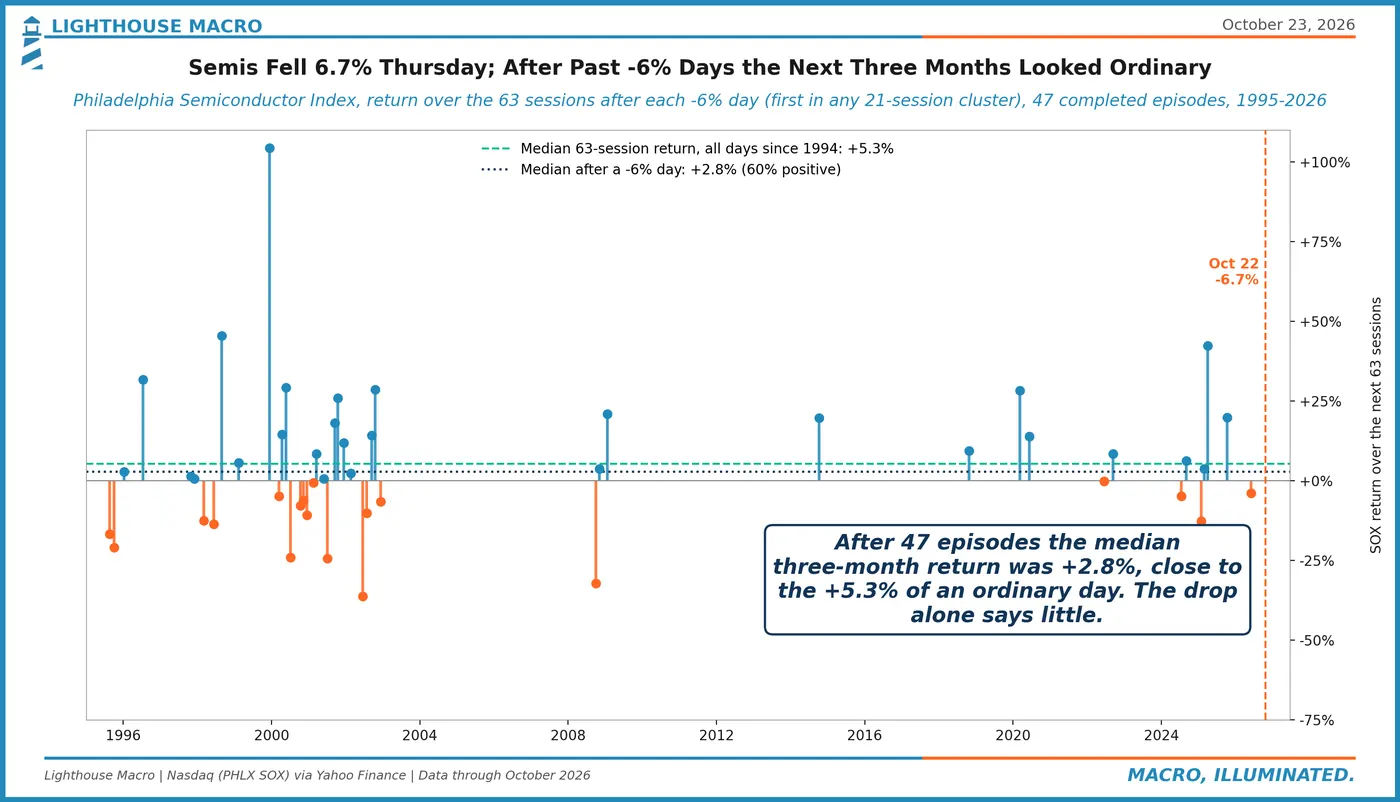
A 6% semis day has not said much about the next quarter. Across 47 prior episodes the median three-month return was +2.8%, against +5.3% for all days. History is a shrug here.
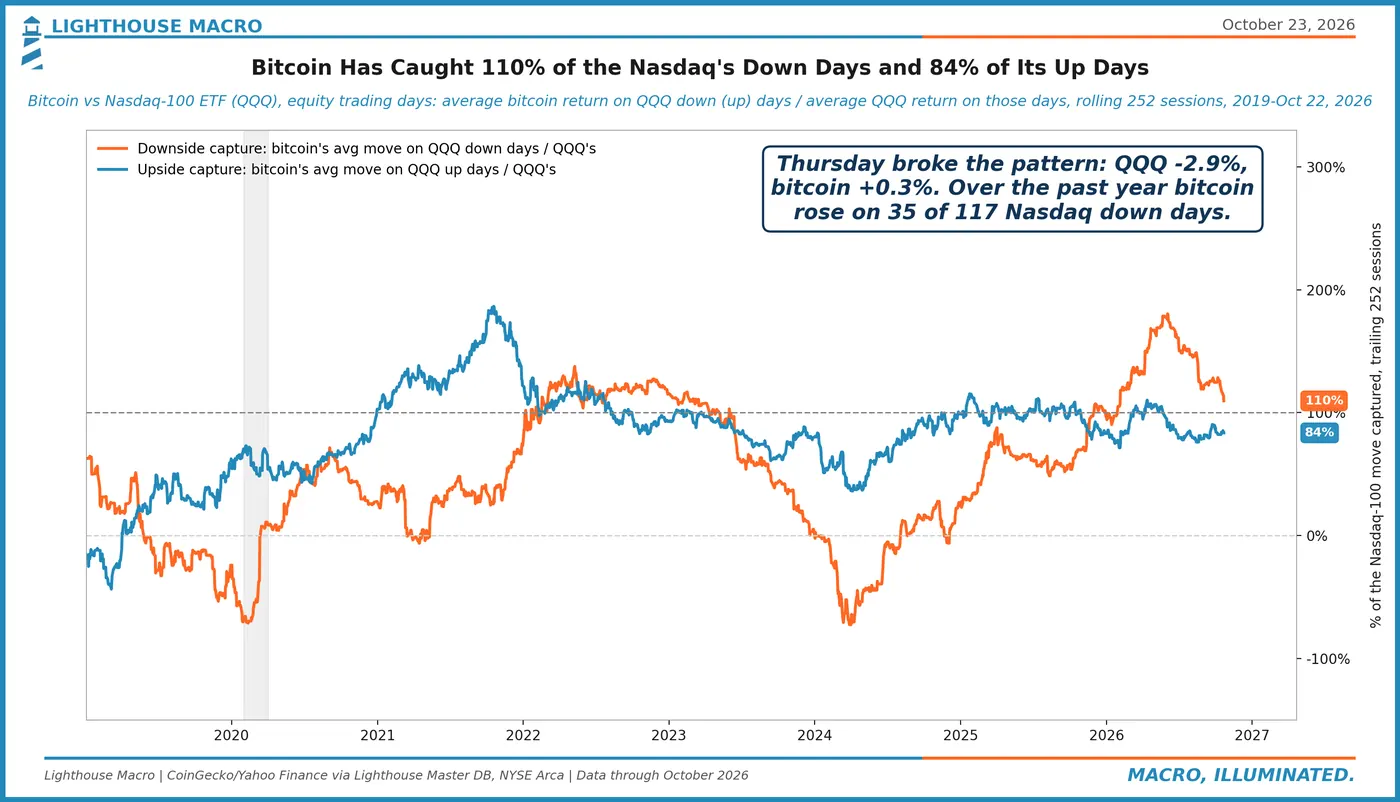
Bitcoin held flat while the Nasdaq fell 2.9%. Over the past year it caught 110% of the Nasdaq's down days and 84% of its up days, so Thursday cut against the pattern.
Oil up, gold downCommodities
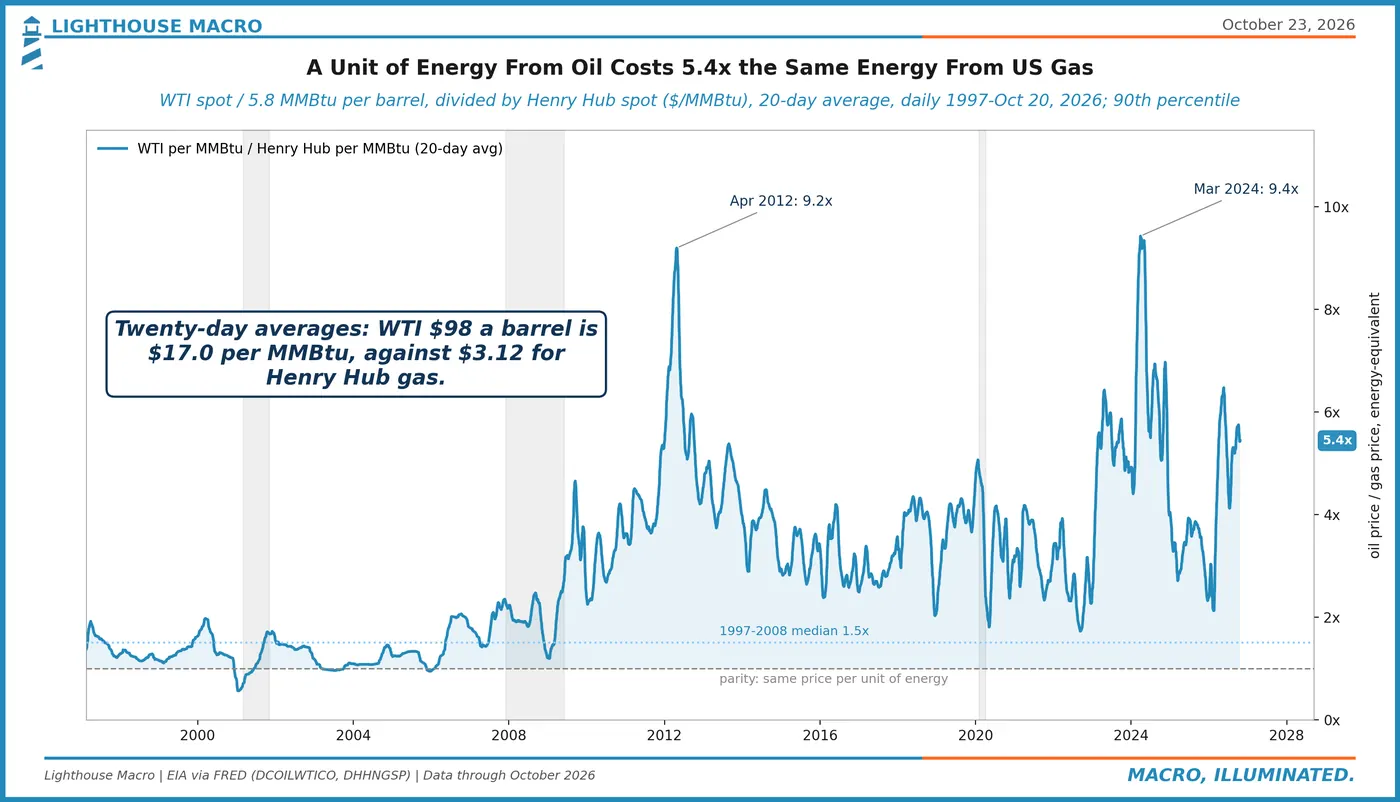
Oil costs 5.4 times US gas for the same energy. WTI at $98 works out to $17.0 per MMBtu against $3.12 for Henry Hub, the 90th percentile since 1997. Before 2008 the ratio sat near 1.5.
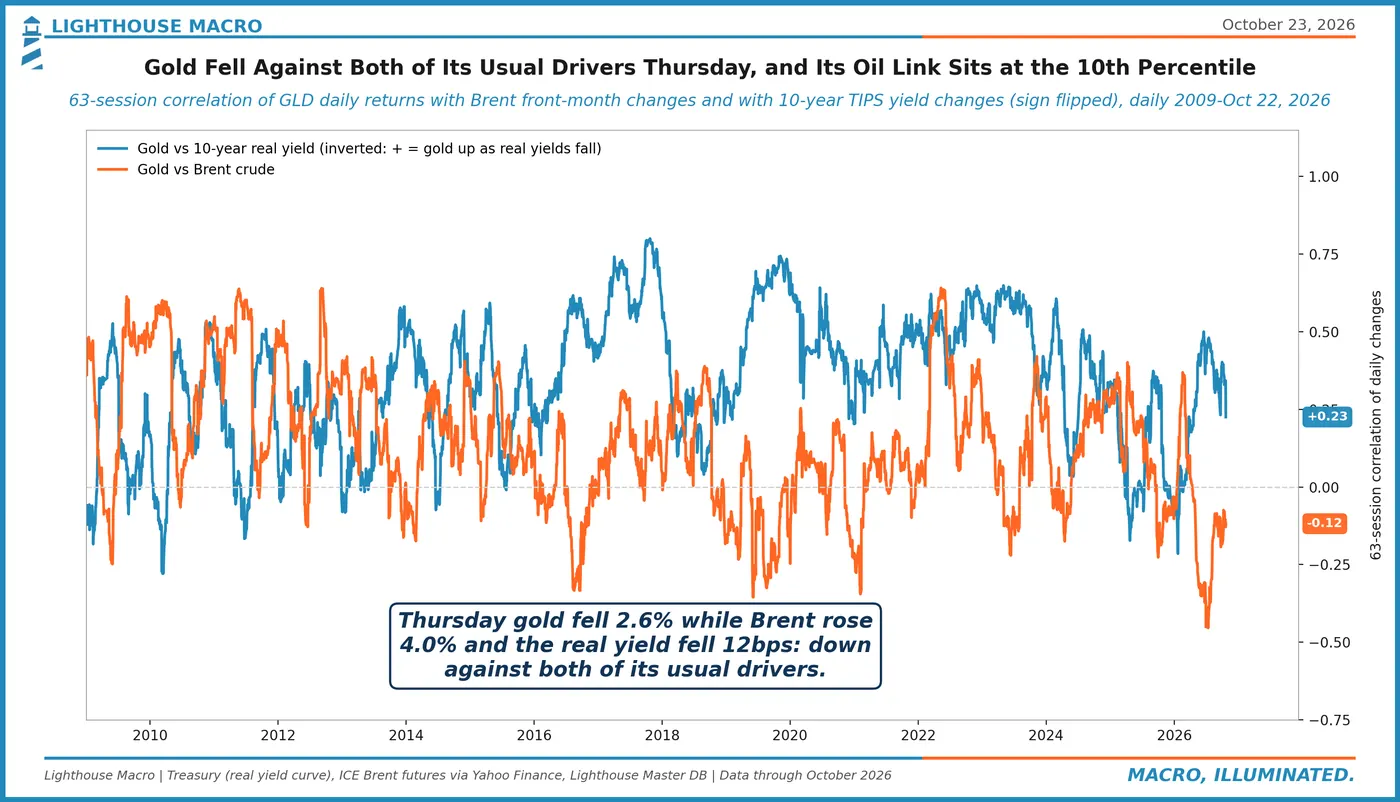
Gold fell against both of its usual drivers. Its 63-day correlation with Brent is -0.12, the 10th percentile since 2009, and Thursday it dropped 2.6% as oil rose and real yields fell.
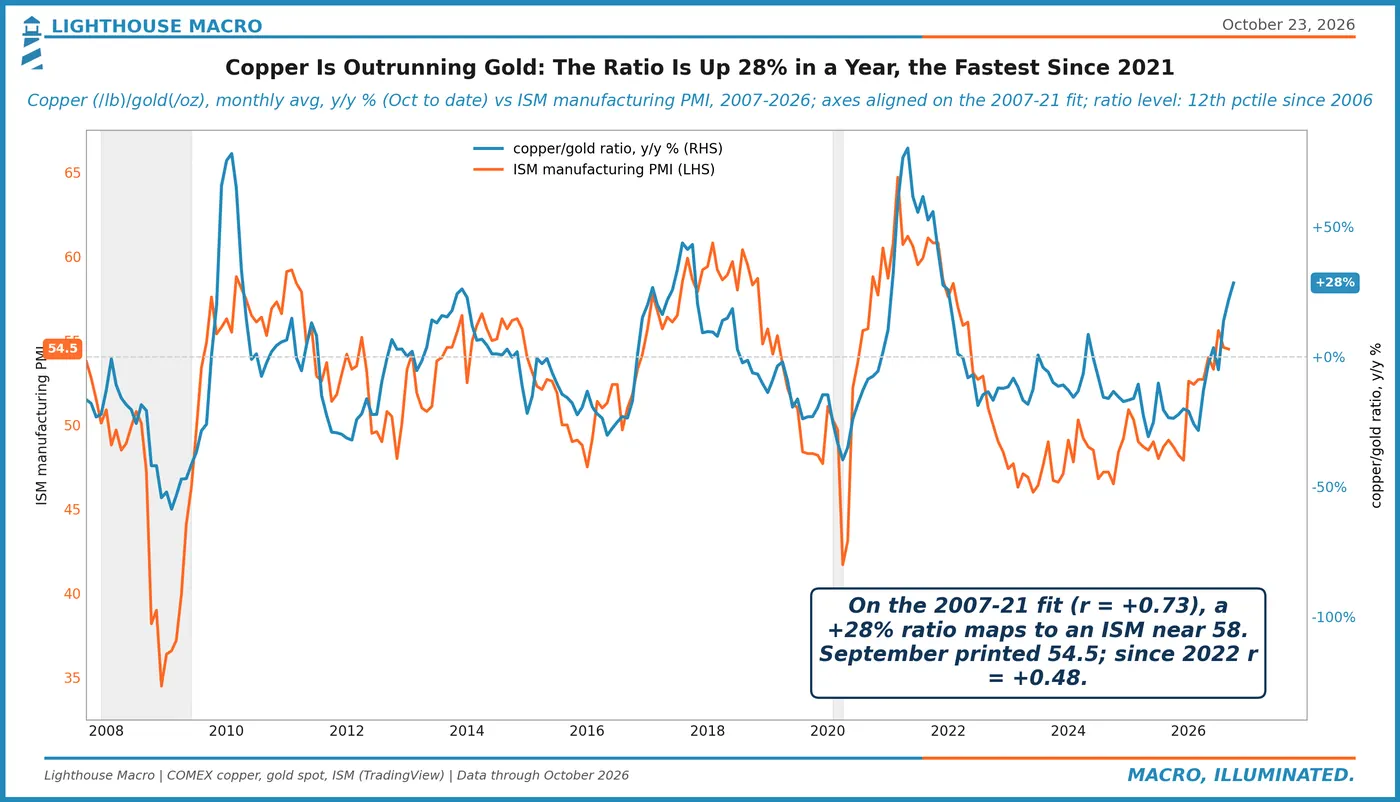
Copper is beating gold by the most since 2021. The ratio is up 28% on the year. On the 2007-21 fit that points to an ISM near 58; September printed 54.5.
Everyone else is still hikingTrade
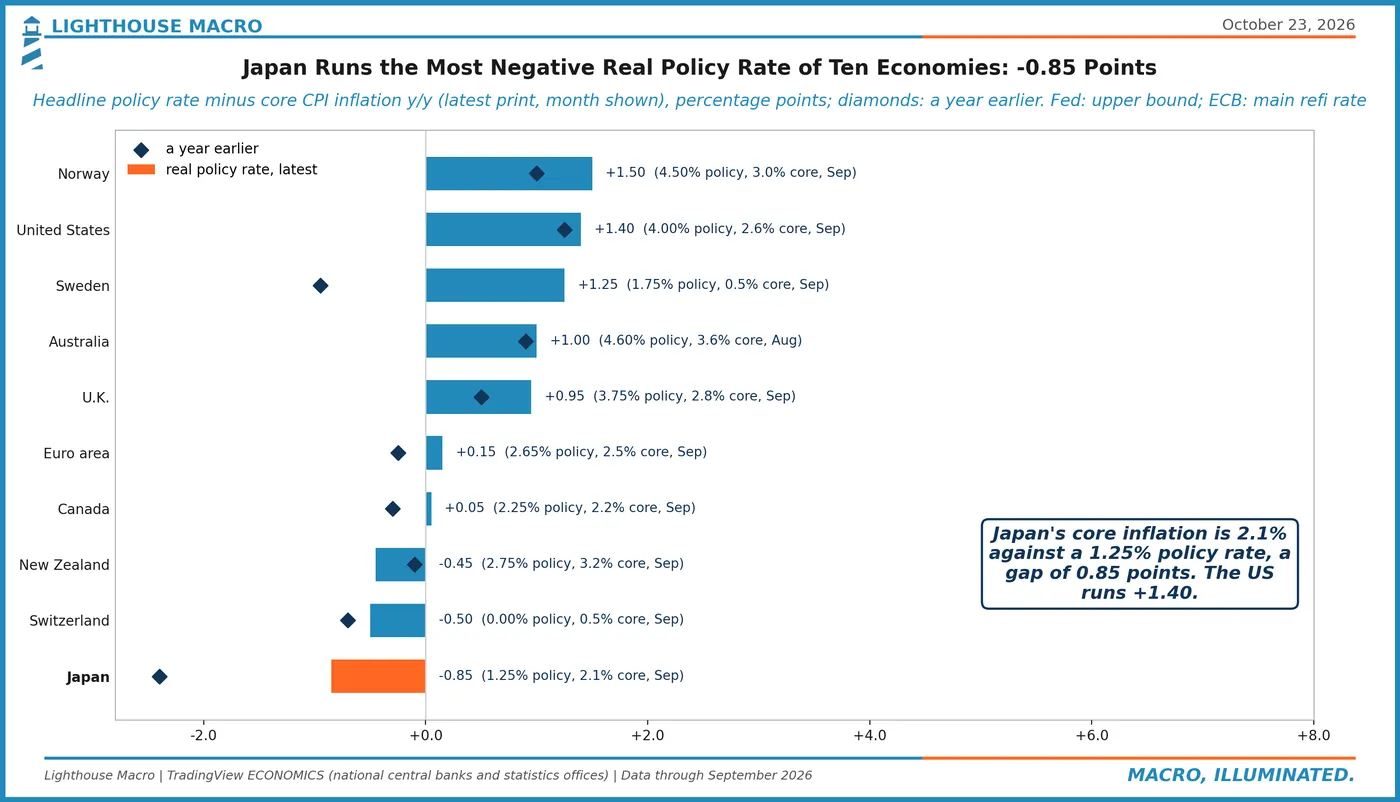
Japan runs the most negative real policy rate of ten economies. Core CPI of 2.1% against a 1.25% policy rate leaves -0.85 points, up from -2.40 a year ago. The US sits at +1.40. The BoJ meets Oct 30.
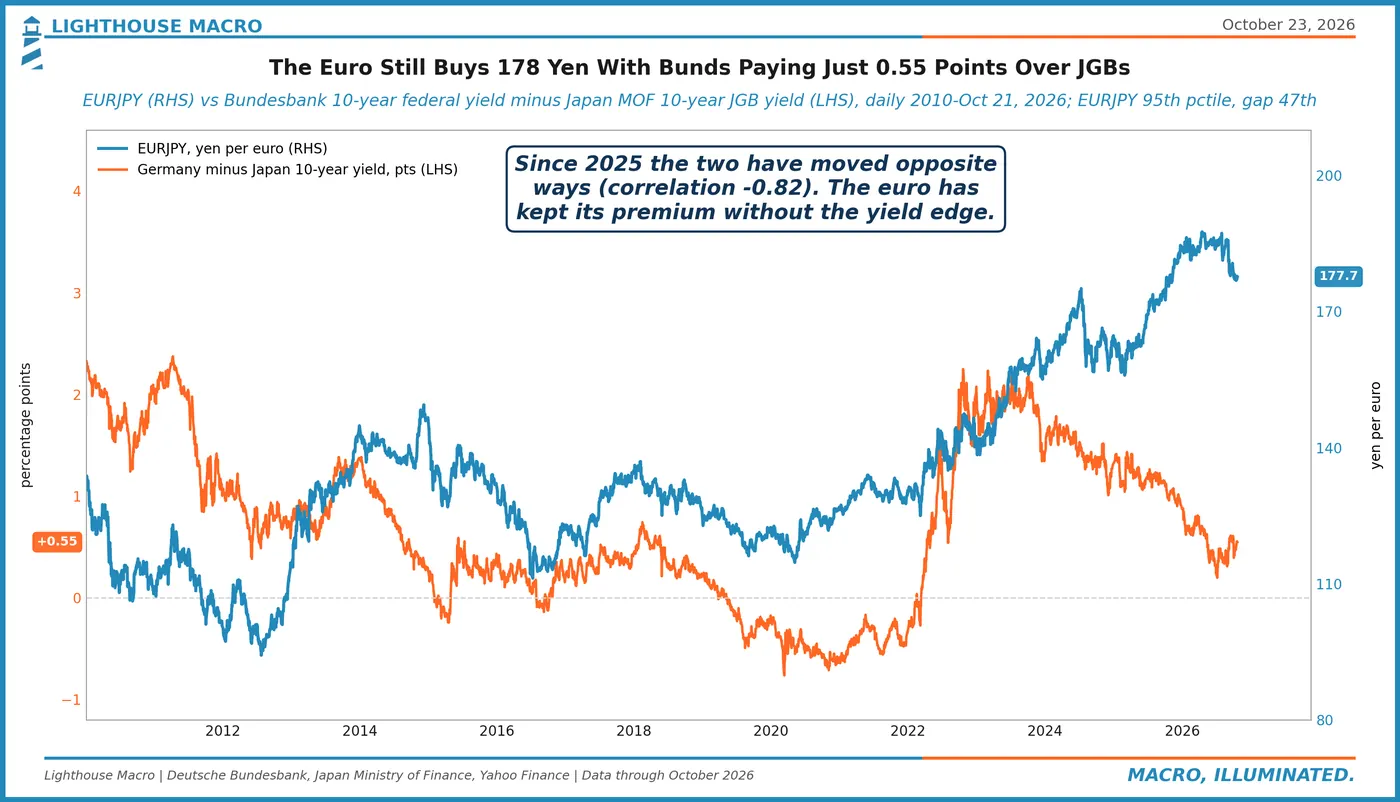
The euro still buys 178 yen without the yield edge. Bunds pay 0.55 points over JGBs, from 2.25 in 2022, yet EURJPY sits in its 95th percentile since 2010.
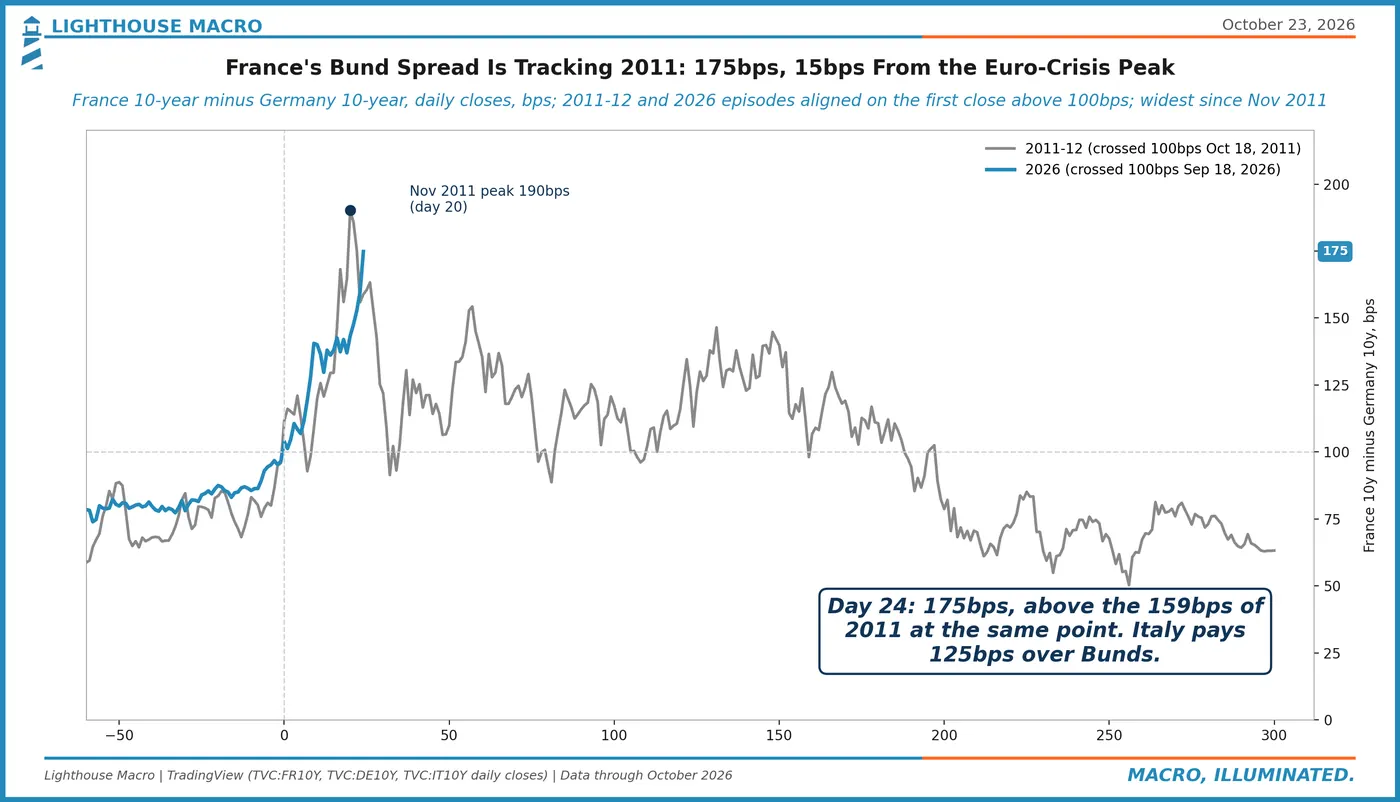
France's Bund spread is running ahead of its 2011 path. It widened 15bps Thursday to 175bps, the widest since November 2011, and sits above where 2011 stood 24 days after crossing 100bps.
Into next week's dataGrowth
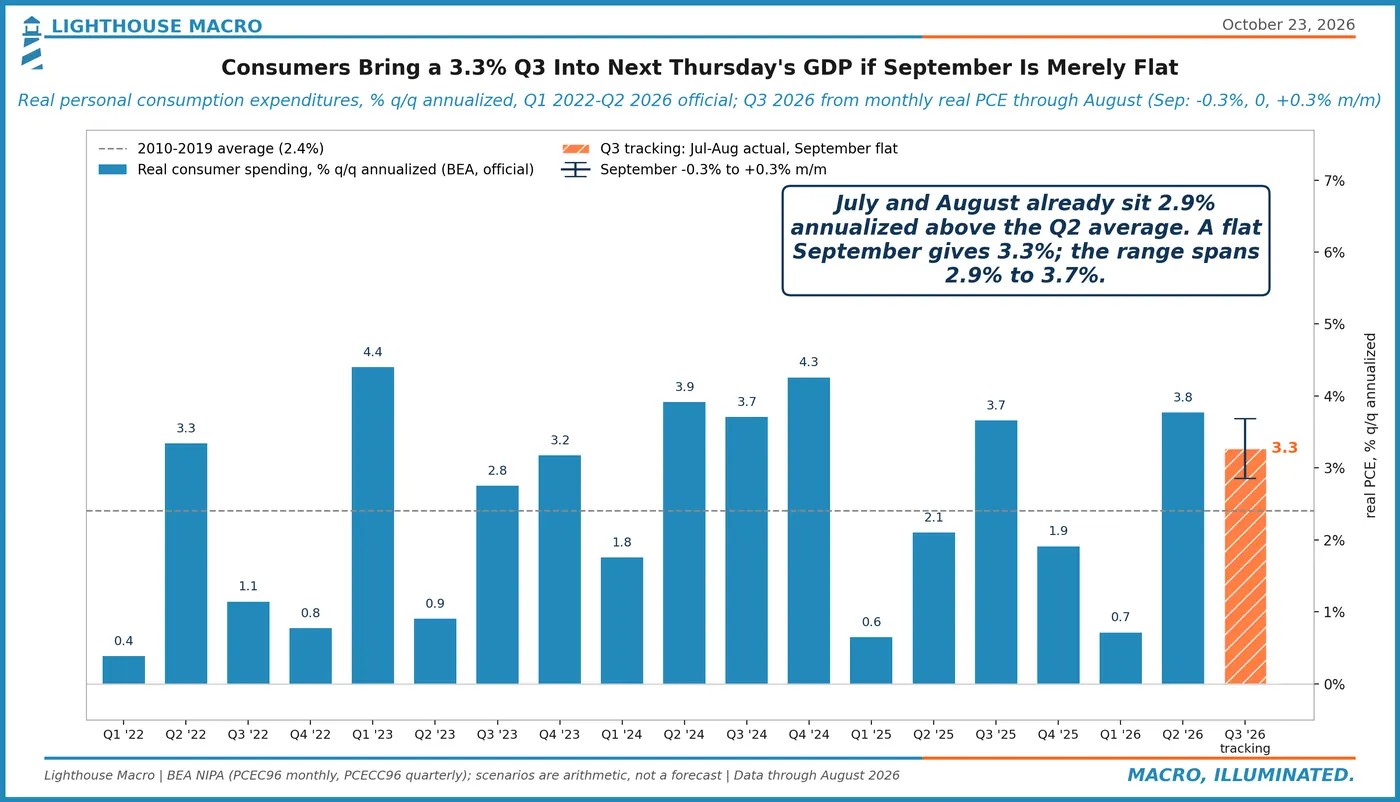
Consumers carry about 3.3% into Thursday's GDP if September is flat. July and August are already 2.9% annualized above the Q2 average. A 0.3% miss either way in September gives 2.9% to 3.7%.
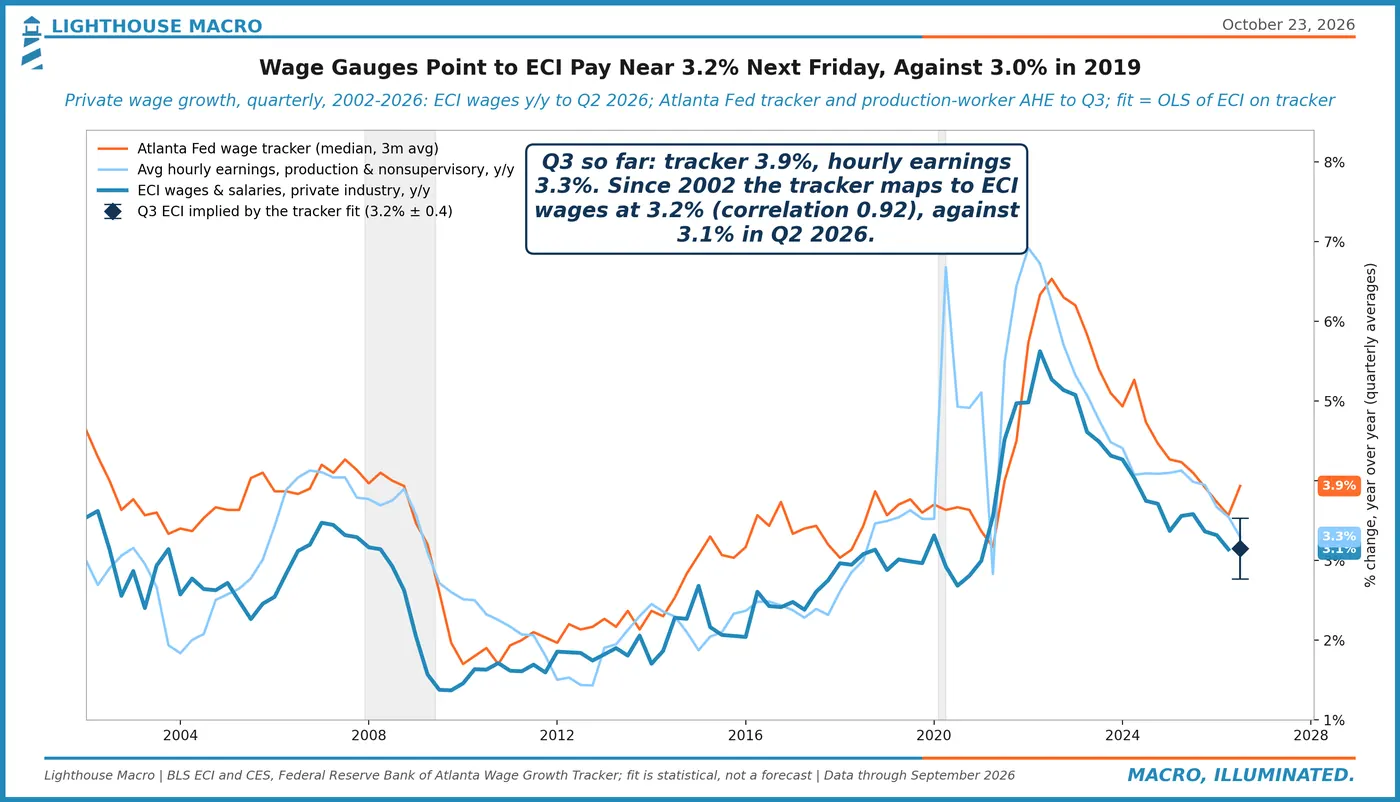
Wage gauges point to ECI pay near 3.2% next Friday. The Atlanta Fed tracker averaged 3.9% in Q3. On its fit to the ECI that is about 3.2%, against 3.1% in Q2 and 3.0% in 2019.