MORNING BRIEF
MACRO, ILLUMINATED.
The Fed meets tomorrow with a hold all but priced, so the more useful question is which inflation the committee thinks it is fighting. Core PCE ran 2.05% annualized over the three months to August while headline sat at 3.42% with oil doing the lifting, and the curve still has roughly two more hikes priced over the next year.
This morning's data did not settle it. Durable goods rose 1.8% almost entirely on aircraft, Conference Board confidence jumped to 91.7 on the present-situation index while expectations stayed under 80, and semis added another 2.8% to Monday's 2.7% with equal weight flat. Thursday's GDP and PCE and Friday's ECI are where the week gets decided.
The tape
- Semis SMH +2.8% by early afternoon after +2.7% Monday; equal weight flat.
- Treasuries 10-year near 4.98%, 2-year near 4.70%, multi-week lows into the meeting.
- Oil WTI -2.0% to $99.7; energy the worst sector on the day.
- Metals Gold +0.9% to $4,076; copper +1.9% to $6.67.
- Credit High-yield spreads 330bps Monday, 8bps tighter on the day.
- Asia KOSPI +3.1%, Nikkei +1.7% overnight.
This week Wed FOMC 2:00 (hold 3.75-4.00% exp.), BoC, RBNZ · Thu 8:30 Q3 GDP and Sept PCE, ECB, 7-year auction · Fri Q3 ECI, BoJ
Papers watch
Transformative AI and demand bottlenecks (BIS WP 1381, Oct 12) A calibrated model finds a demand bottleneck more plausible than a transformative path: growth rises briefly, then slips below about 2% as weak consumer demand stalls AI investment.
Are stablecoins and bank deposits substitutes? (BIS WP 1382, Oct 13) Higher deposit rates are followed by slower stablecoin growth, about 3 points of market-cap growth per basis point of deposit repricing, more for USDC than USDT.
News shocks and inflation: large oil discoveries (BIS WP 1389, Oct 23) Big oil and gas finds lift core prices for about a decade, half before extraction, through non-tradable services, mostly where exchange rates are pegged.
Into the FedRates
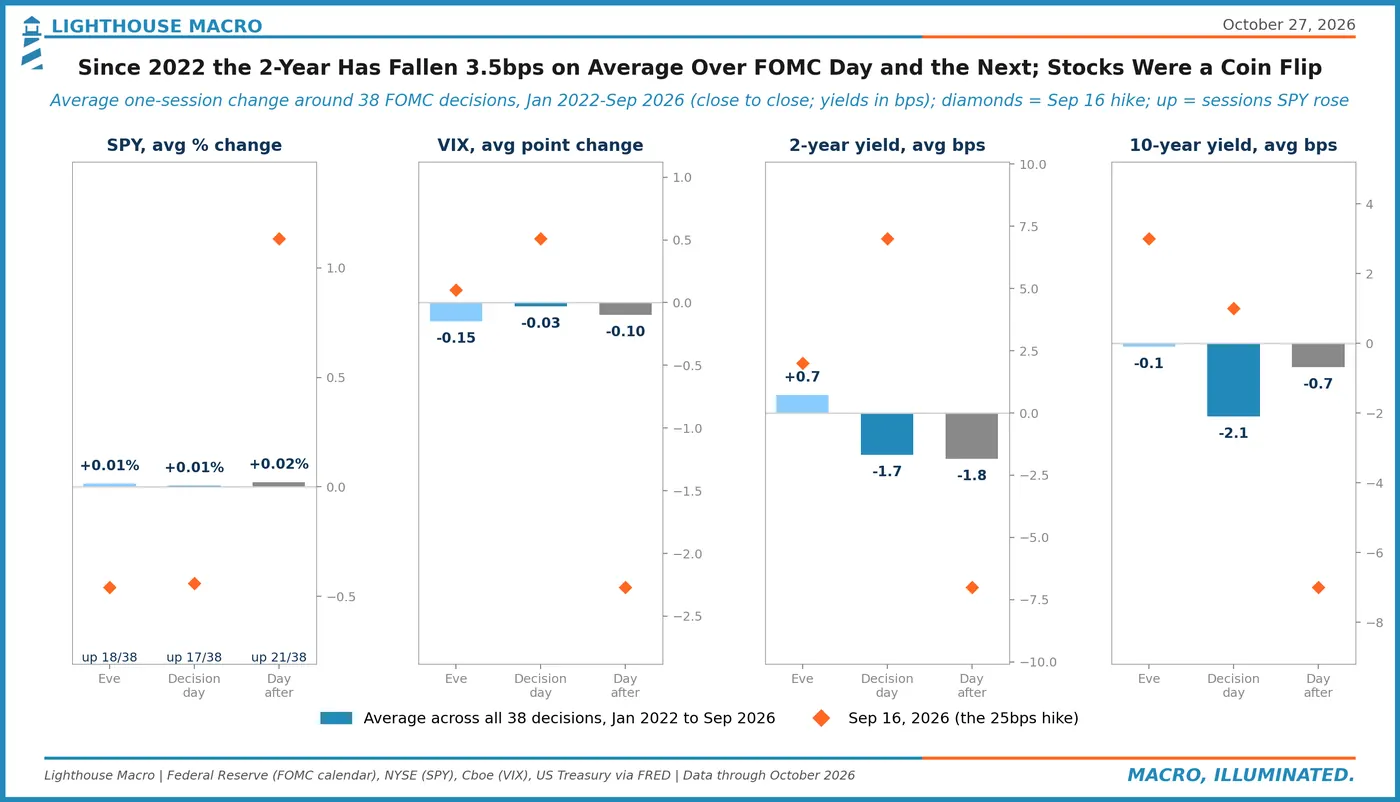
Fed days since 2022 have been a coin flip for stocks. Across 38 decisions, SPY averaged +0.01% on the day and rose 17 times. The 2-year fell 1.7bps on average; on the Sep 16 hike it rose 7bps, then gave it all back the next session.
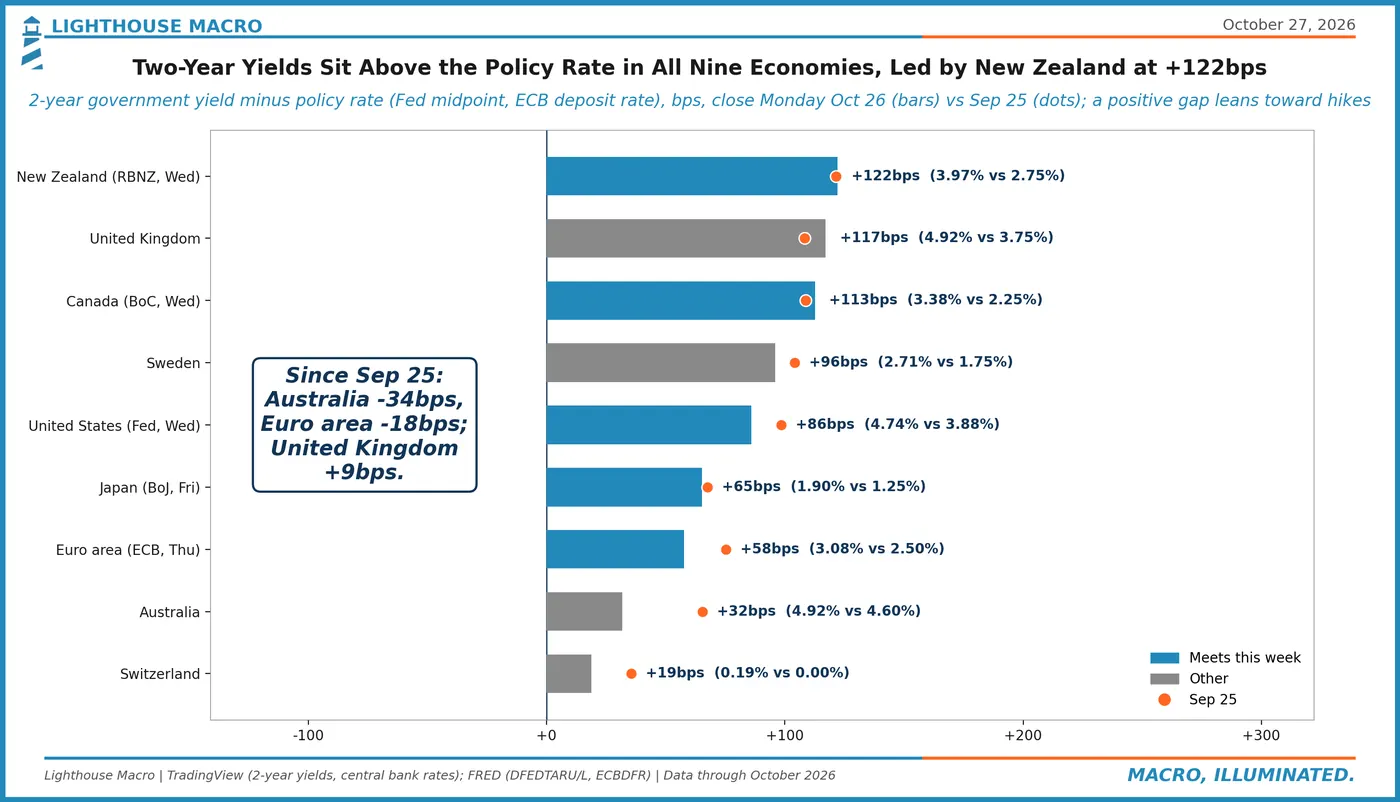
Two-year yields sit above policy rates in all nine economies. The US 2-year pays 86bps over fed funds, New Zealand's 122bps and Canada's 113bps over theirs, with Japan 65bps over the BoJ. Five of these central banks decide by Friday, and the Fed goes first.
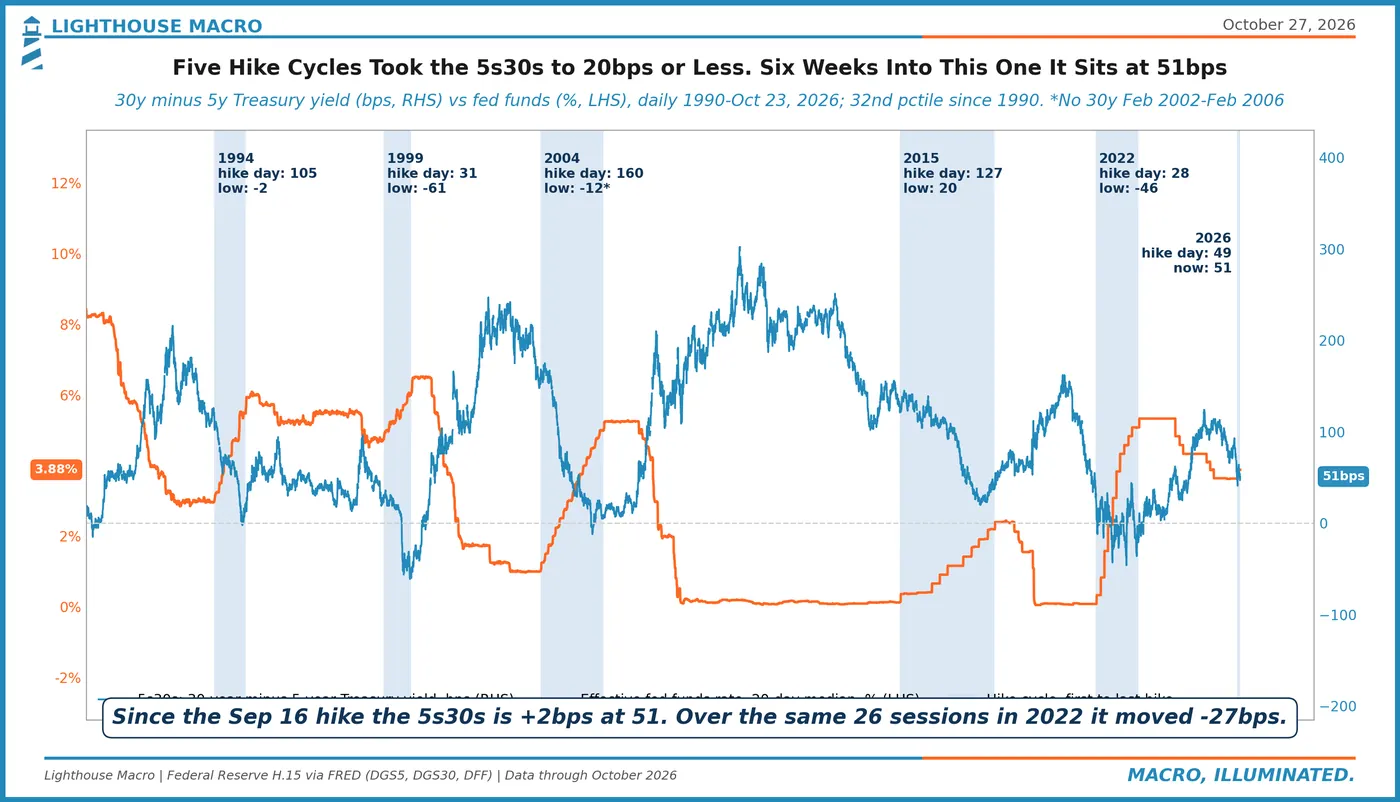
The long end is holding its slope while the Fed hikes. The 5s30s curve was 51bps on Friday, 2bps steeper than on the Sep 16 hike. Over the same stretch in 2022 it flattened 27bps, and all five cycles since 1994 took it to 20bps or less.
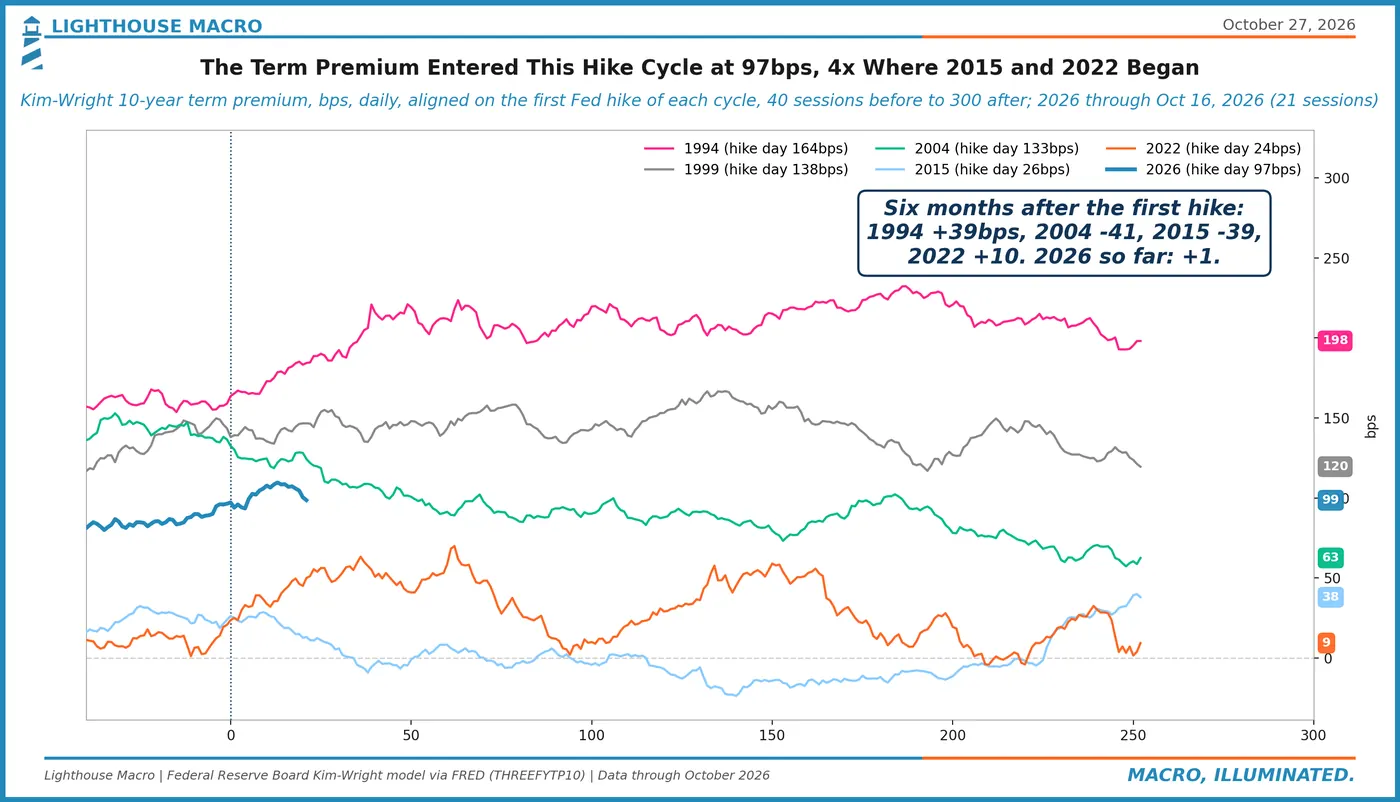
The term premium entered this cycle near four times 2015's level. The Kim-Wright 10-year term premium began this hike cycle at 97bps, against 26 in 2015 and 24 in 2022, and sat at 99 on Oct 16. Six months after the 2004 and 2015 first hikes it was about 40bps lower.
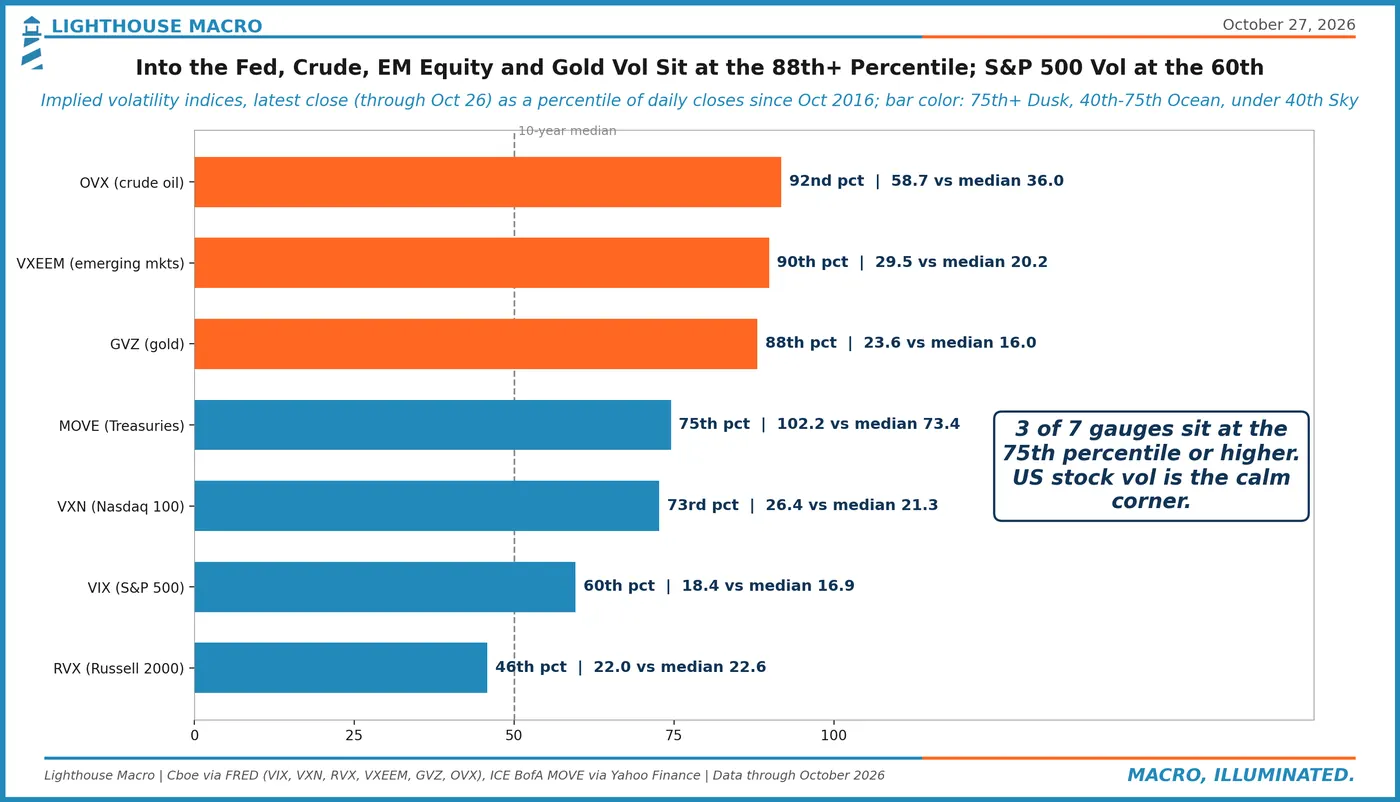
Into the Fed, the fear sits in oil, gold and EM. Crude vol is at the 92nd percentile of the last decade, EM equity vol the 90th and gold the 88th. The VIX at 18.4 is only the 60th, and small-cap vol sits below its median.
This morning's prints and the data weekGrowth
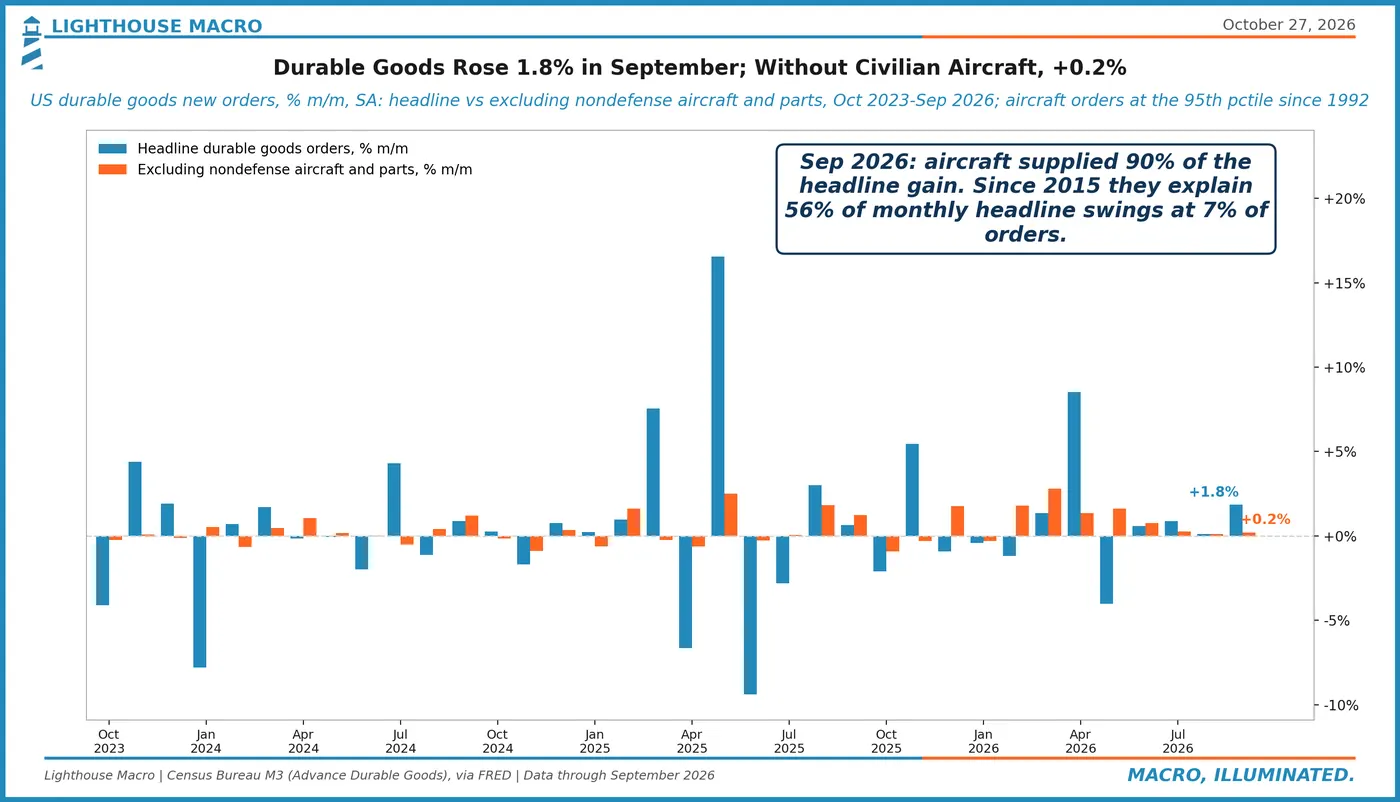
Strip out the hangar and durable goods barely moved. September orders rose 1.8%, but civilian aircraft jumped 28.4% and supplied about 90% of the gain. Everything else rose 0.2%, which is the number we would carry into Thursday's GDP.
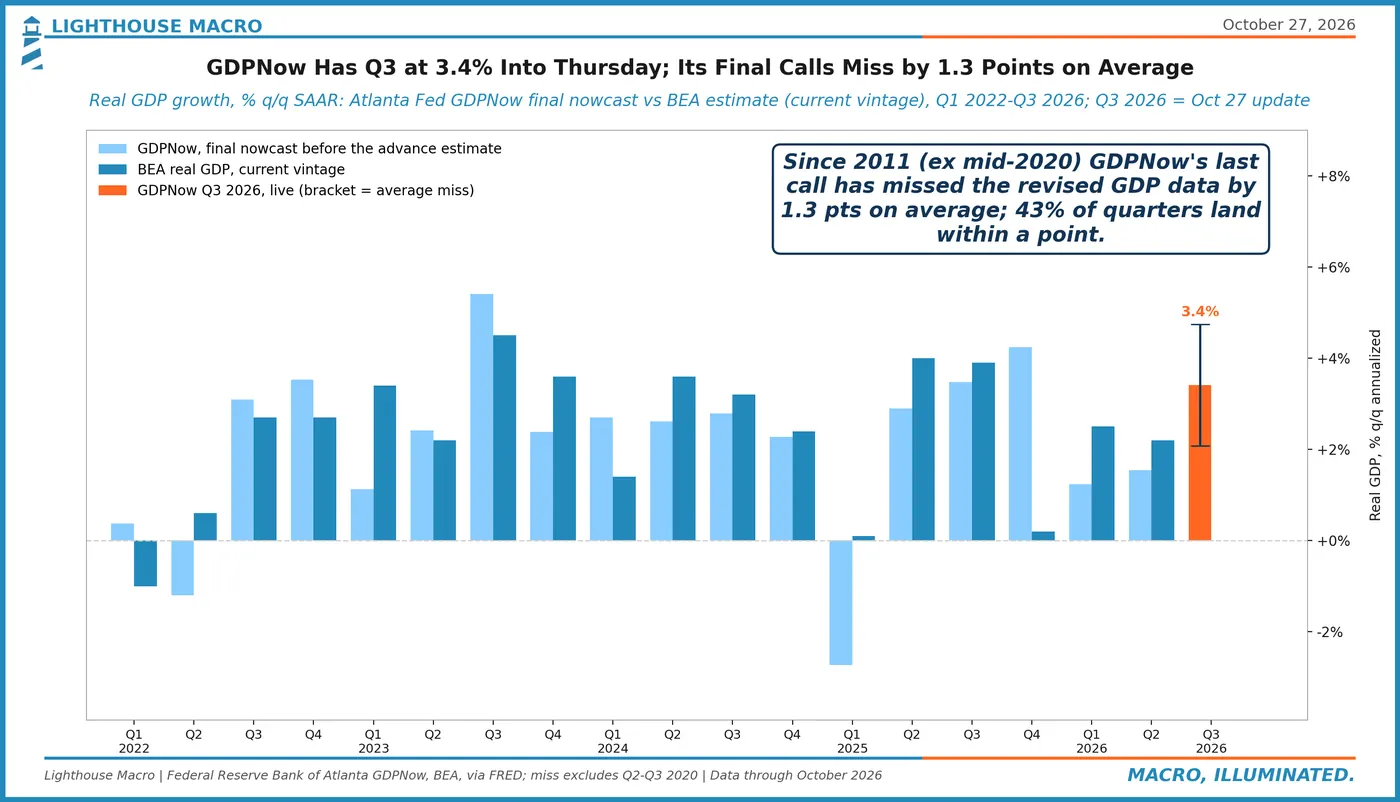
GDPNow says 3.4% into Thursday, with a wide error band. Its final calls since 2011 have missed revised GDP by 1.3 points on average; Q2 was nowcast at 1.5% and now sits at 2.2%. Even a typical-size miss leaves Q3 near 2.1%.
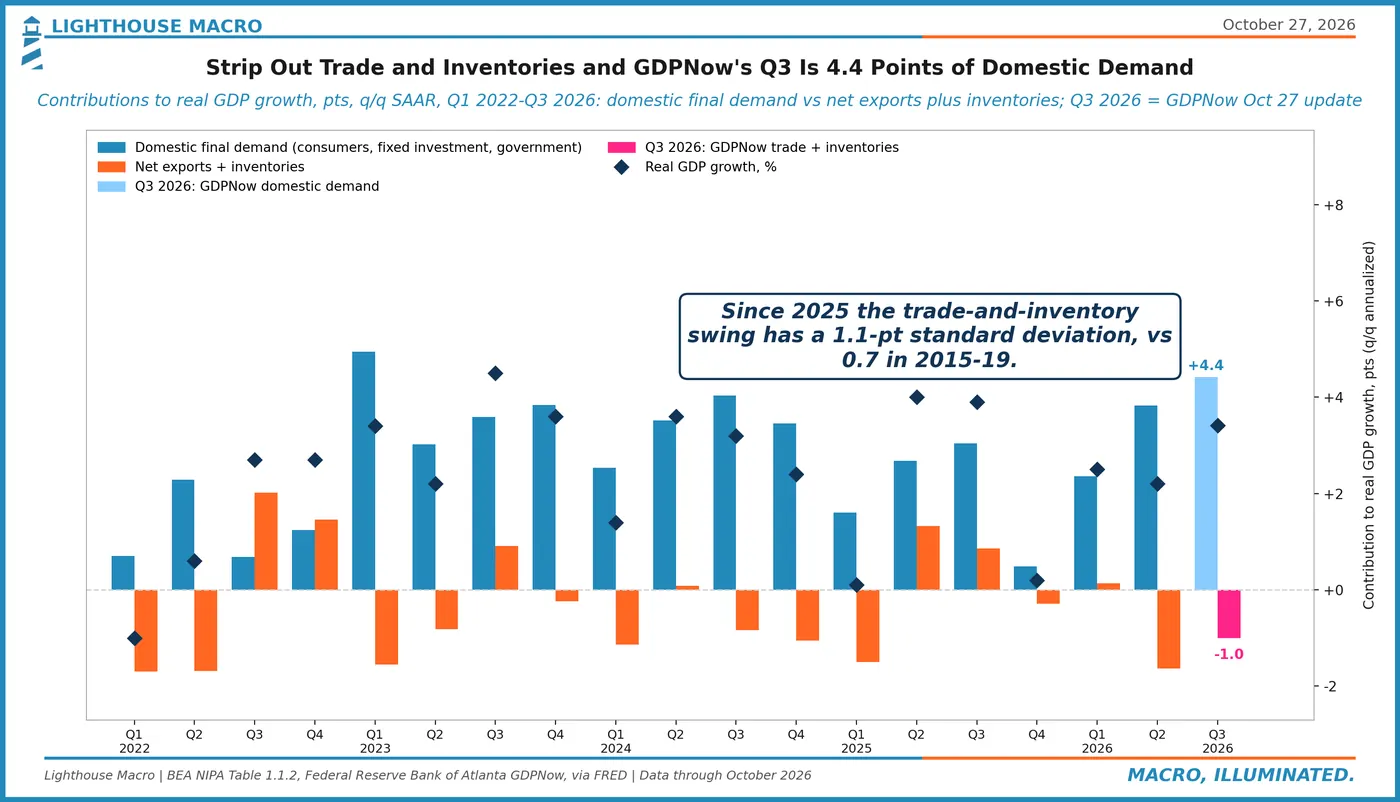
Under the headline, Q3 looks like 4.4 points of domestic demand. GDPNow's 3.4% nets domestic demand against a 1.0-point drag from trade and inventories: net exports -2.9, inventories +1.8. That swing has been wider since 2025, so read Thursday through the demand line.
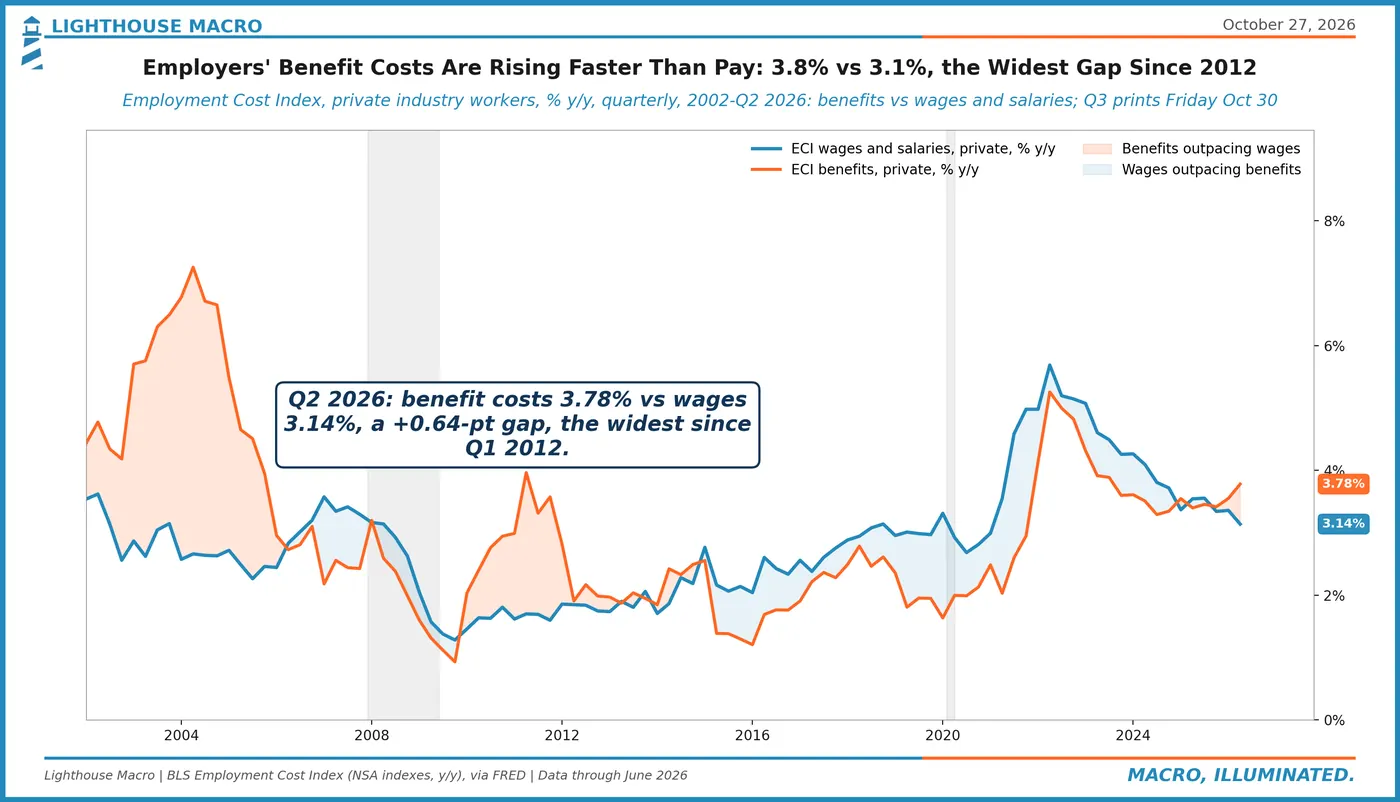
What a worker costs is cooling slower than what a worker earns. Into Friday's ECI, private benefit costs rose 3.78% y/y in Q2 against 3.14% for wages, the widest gap since 2012. For employers the labor bill is stickier than the pay data suggest.
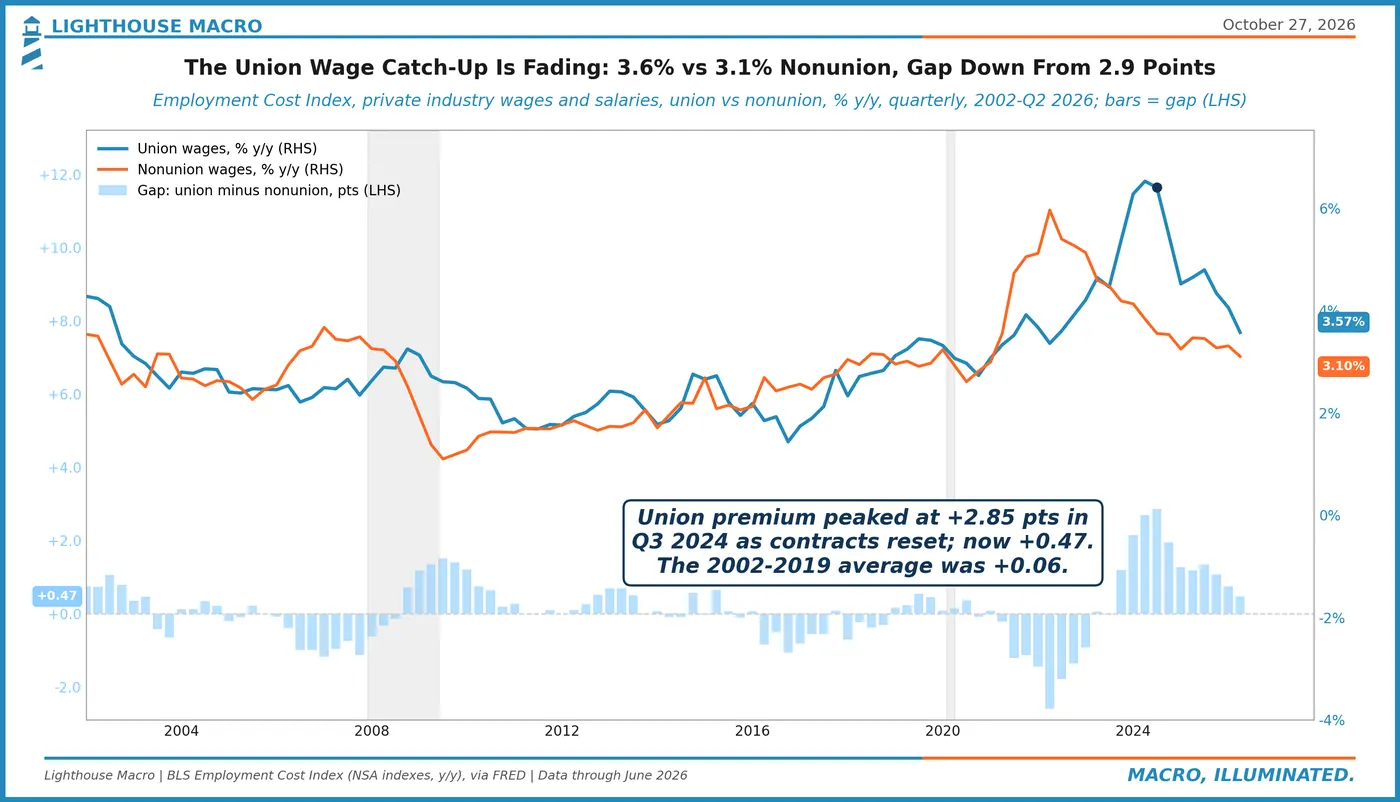
The union wage catch-up is close to finished. Union wages rose 3.57% y/y in Q2 against 3.10% nonunion. The gap peaked at 2.85 points in Q3 2024 as post-2022 contracts reset and is now 0.47, so one source of wage heat into Friday is fading.
The chip tapeStructure
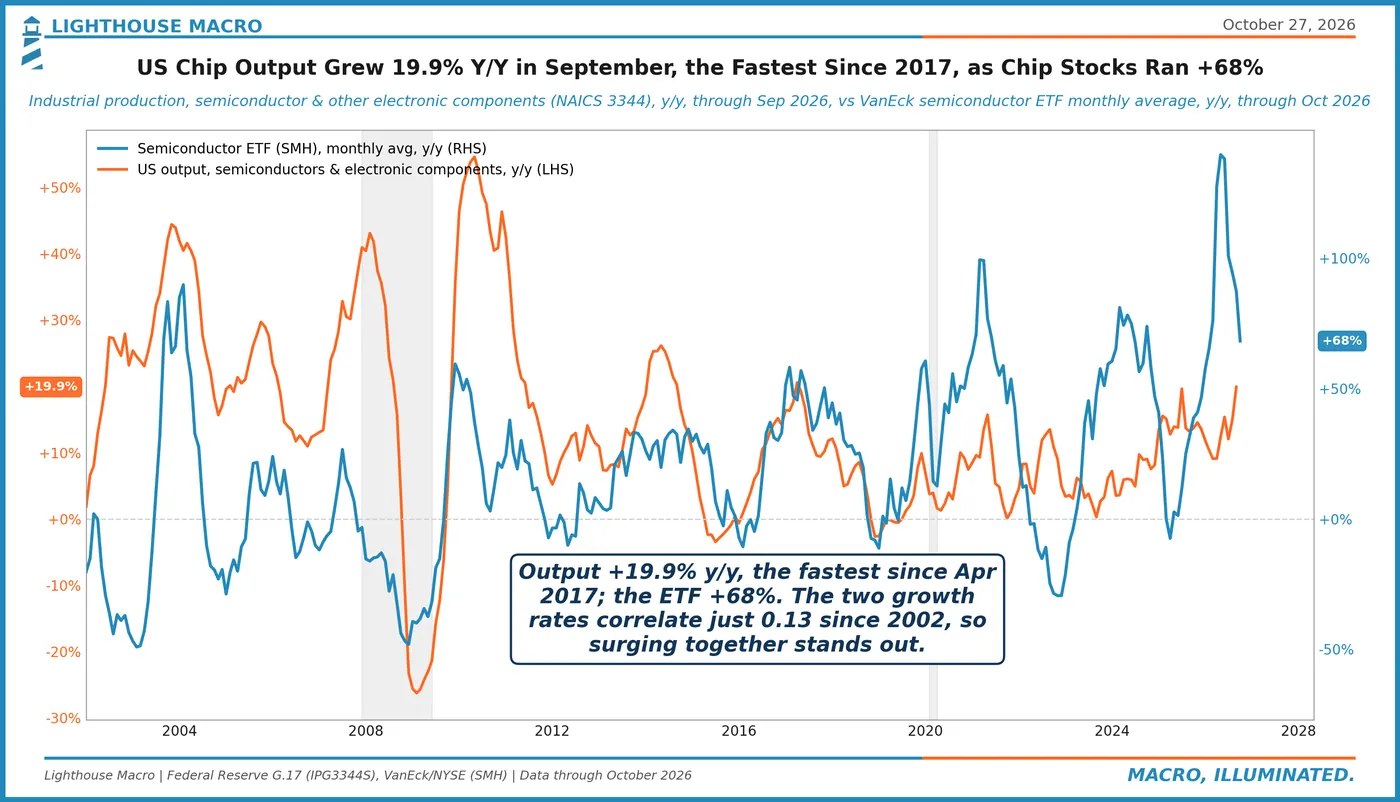
The factories are backing the chip tape this time. US output of semiconductors and electronic components rose 19.9% y/y in September, the fastest since April 2017, with the chip ETF up 68%. The two rarely move together: correlation since 2002 is 0.13.
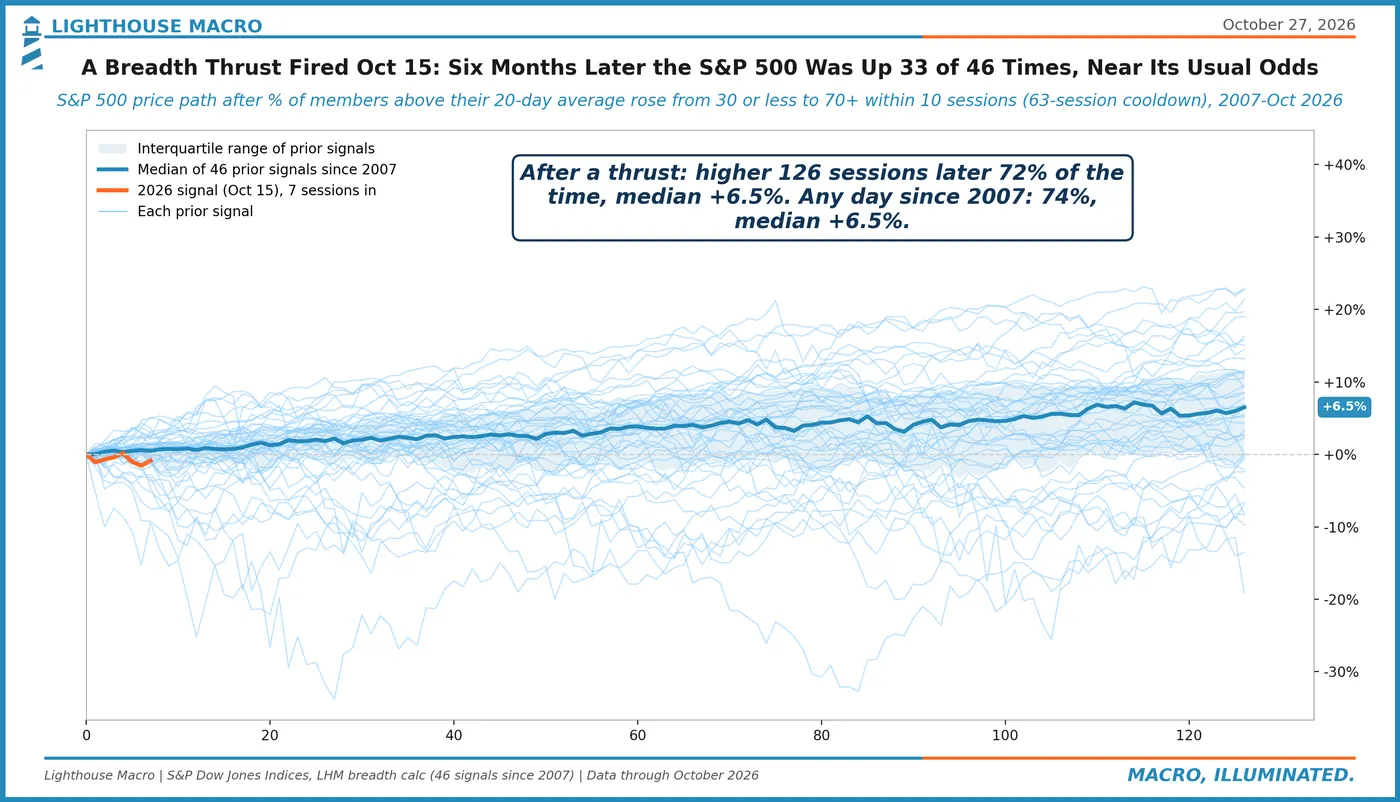
The Oct 15 breadth thrust reads as a mild tailwind. Members above their 20-day average went from 26% to 70% in ten sessions. After 46 such signals since 2007 the index was higher six months on 72% of the time, close to the 74% of any day.
Debt and credit at a 5% ten-yearFinancial
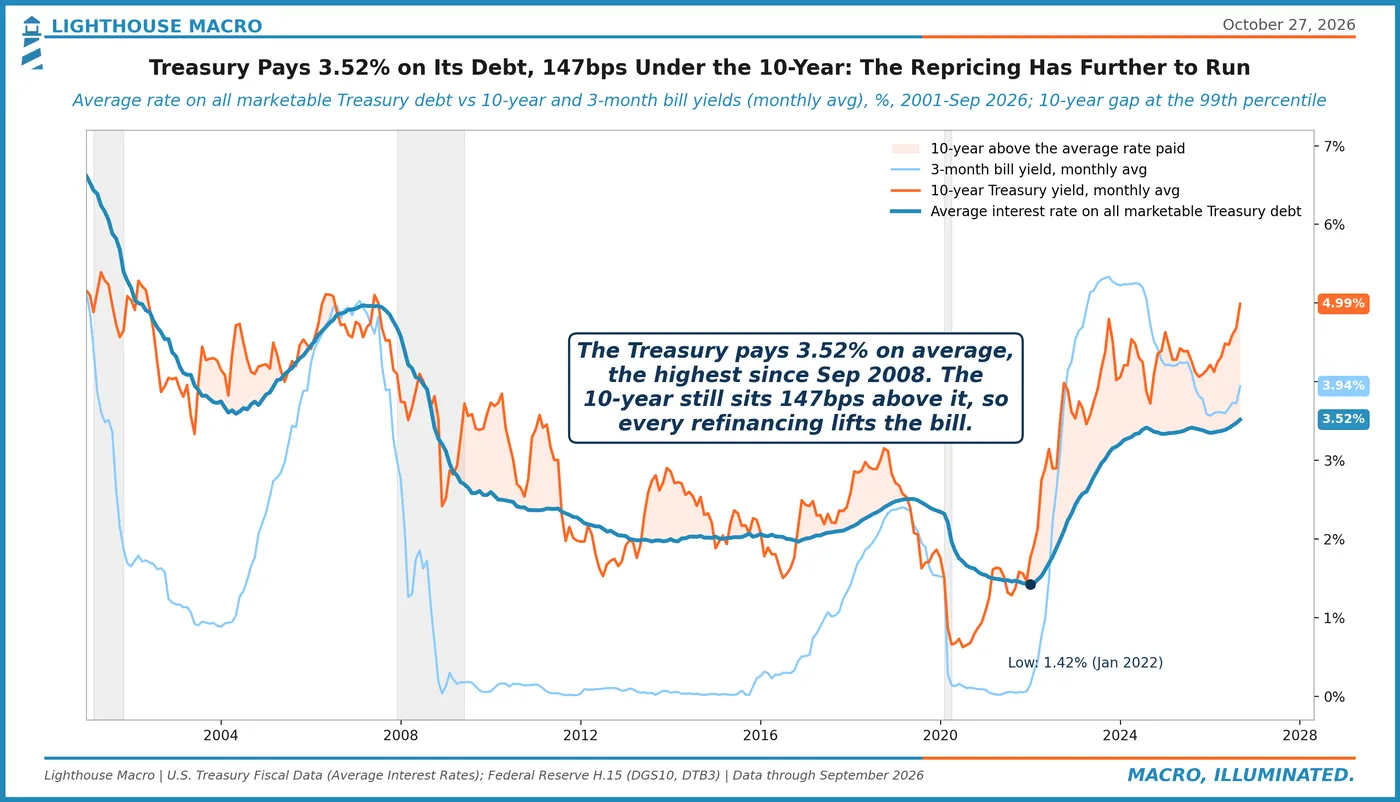
Treasury's average borrowing cost is still catching up to the market. The Treasury paid an average 3.52% on its marketable debt in September, the highest since 2008, while the 10-year averaged 4.99%. Each maturing note that rolls over lifts the interest bill a little more.
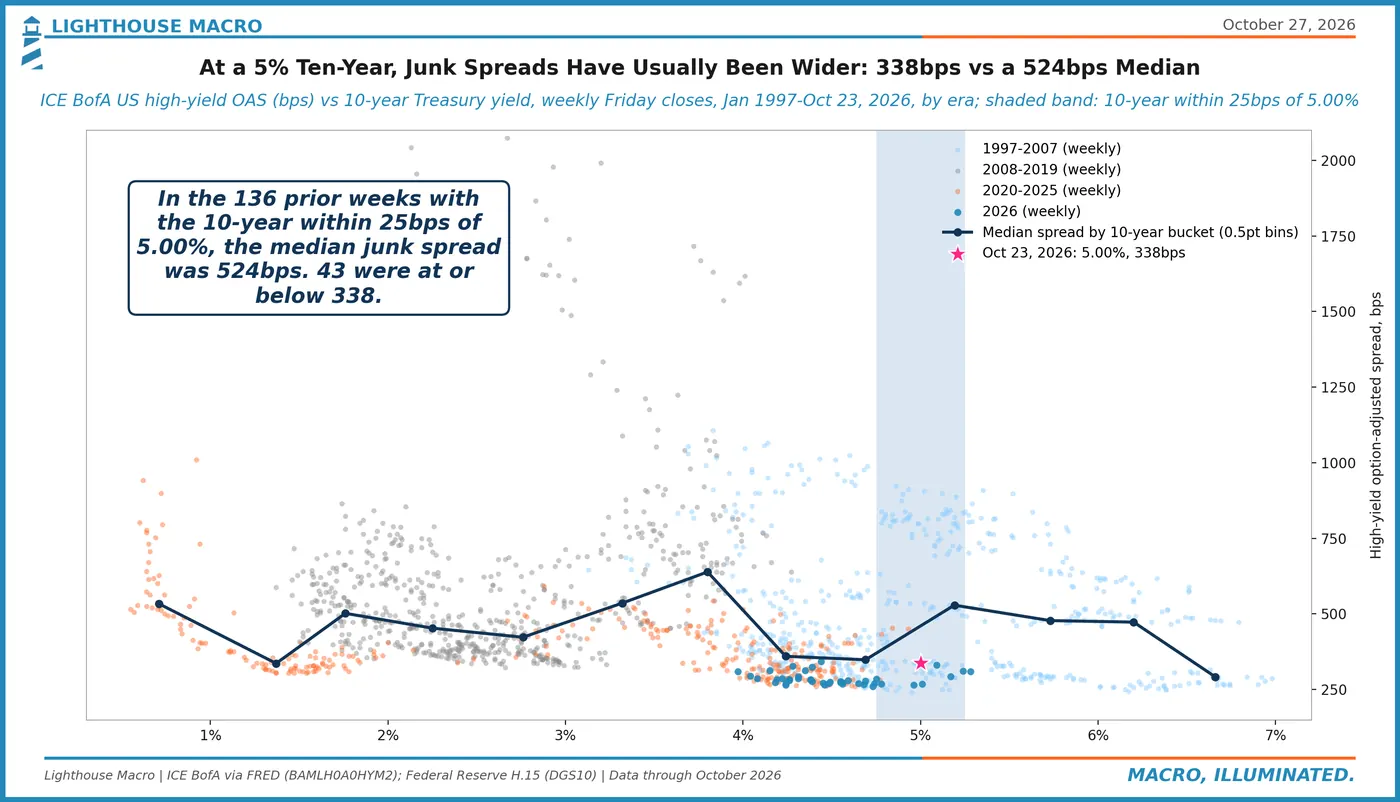
At a 5% ten-year, junk spreads have usually been far wider. High-yield spreads were 338bps with the 10-year at 5.00% on Friday. In the 136 prior weeks with the 10-year that close to 5%, the median spread was 524bps. Buyers are paying up for credit.
Elsewhere
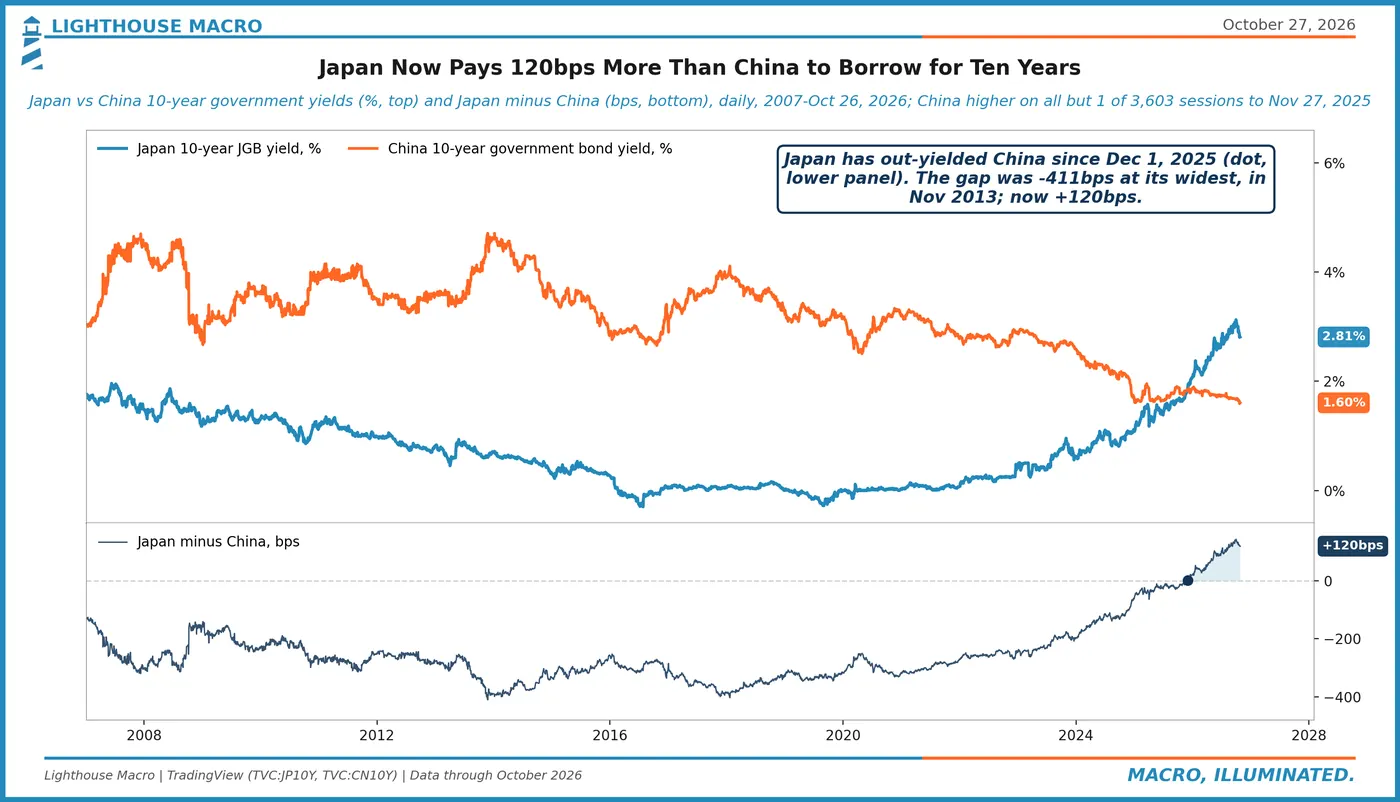
Japan now pays more than China to borrow for ten years. Japan's 10-year yielded 2.81% on Monday against China's 1.60%, a 120bps gap from -13bps a year ago. China out-yielded Japan on all but one session from 2007 to late 2025. The BoJ decides Friday.
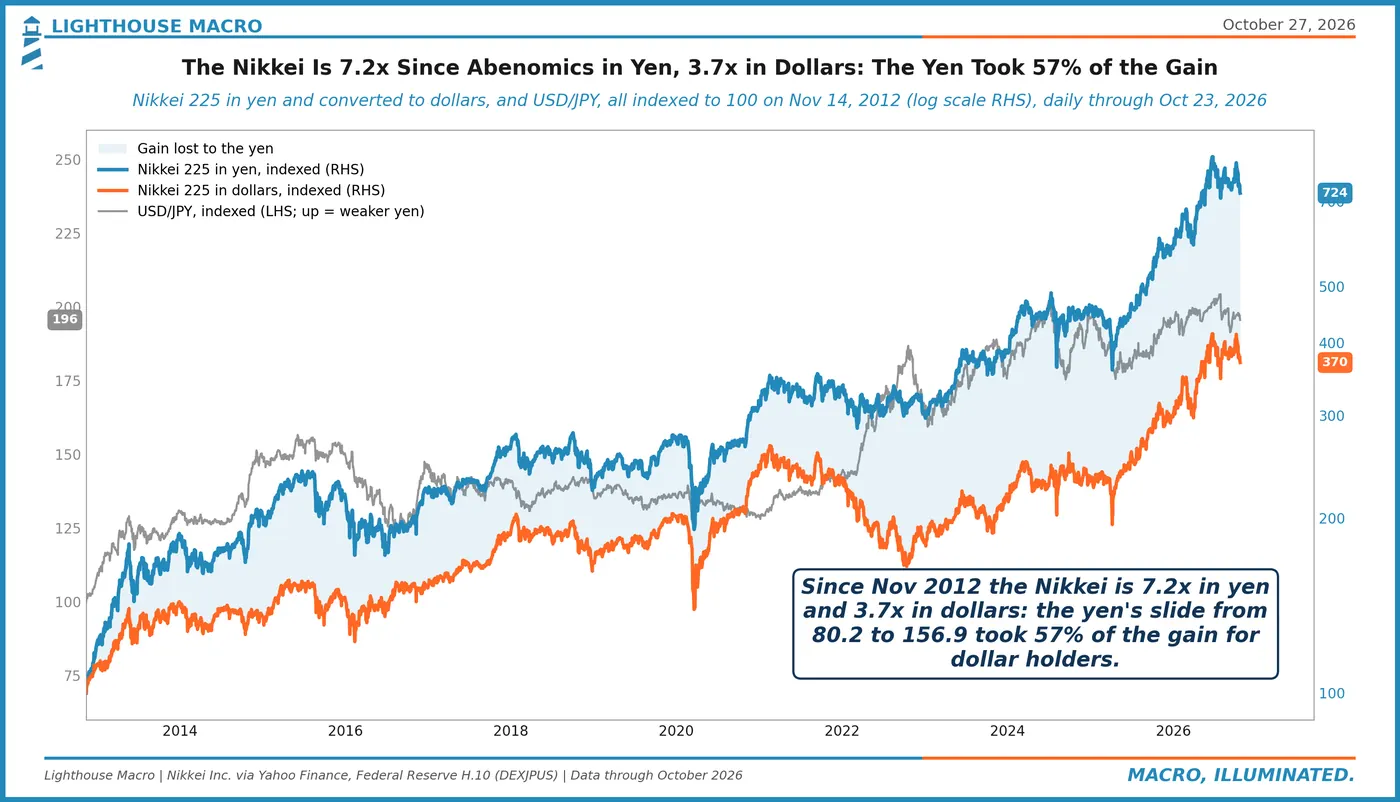
Since Abenomics, the yen took more than half the Nikkei's gain. From November 2012 the Nikkei is 7.2 times higher in yen but 3.7 times in dollars, with USD/JPY from 80 to 157. The BoJ meets Friday; a firmer yen would hand dollar holders some of it back.
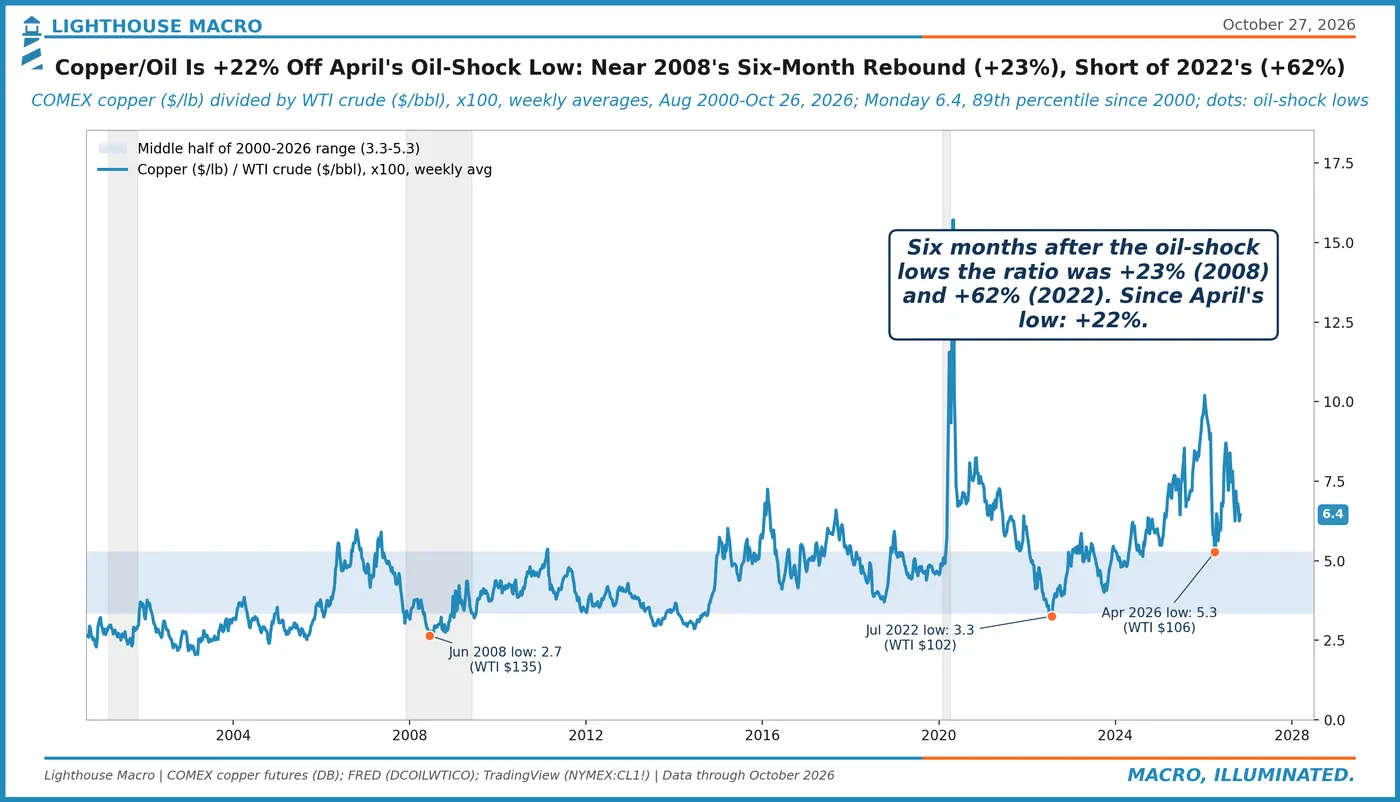
Copper is outrunning oil off April's oil-shock low. Copper at $6.56 and WTI near $102 on Monday put copper/oil at 6.4, up 22% from April's low and the 89th percentile since 2000. After the 2008 low it rebounded 23% in six months; after 2022, 62%.
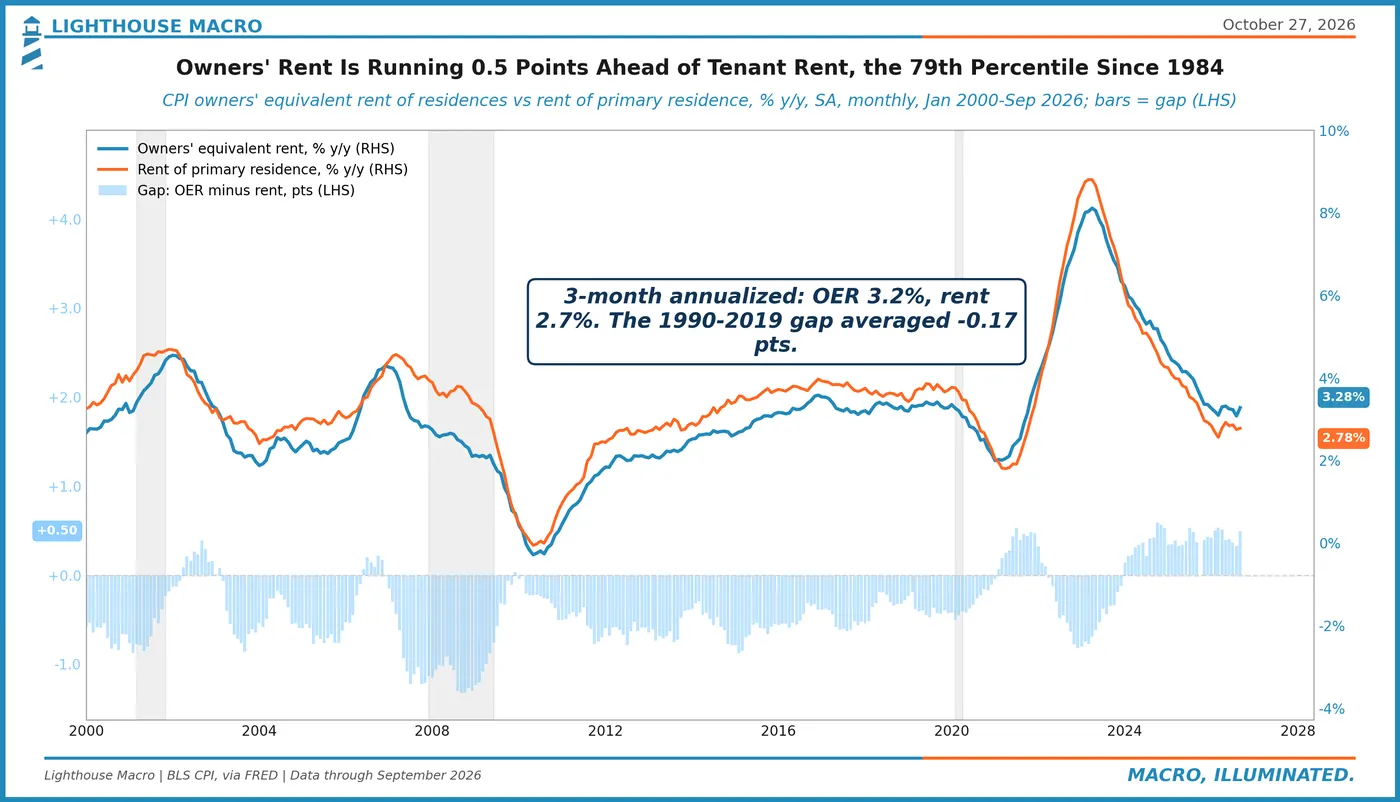
Owners' rent is still running ahead of what tenants pay. September CPI had owners' equivalent rent up 3.28% on the year against 2.78% for tenant rent, a half-point gap at the 79th percentile since 1984. OER carries the bigger CPI weight, so shelter disinflation lags.
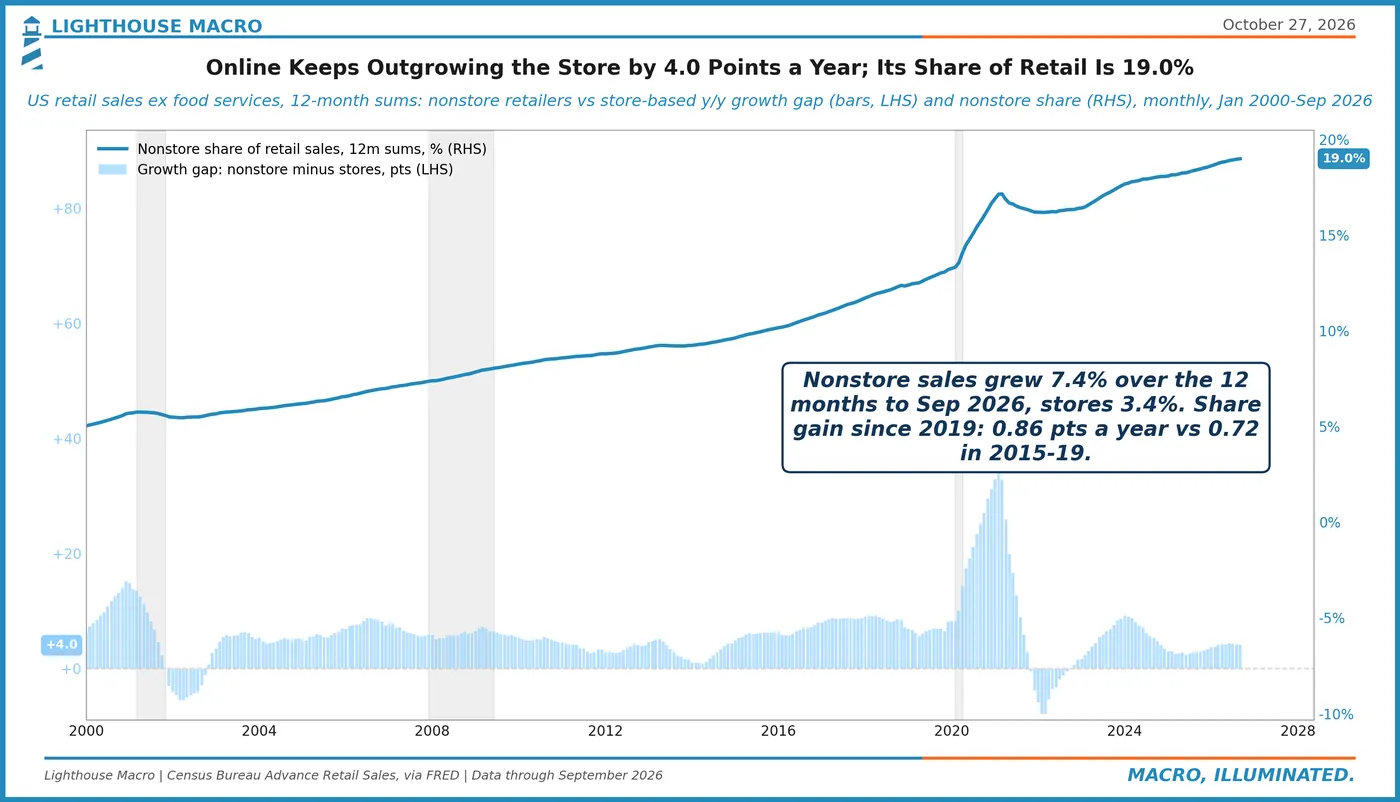
Online keeps taking share from the store, a bit more slowly. Nonstore retailers took 19.0% of retail sales over the year to September, growing 7.4% against 3.4% for stores. The four-point gap is below its 2010s average, yet the share still climbs almost a point a year.
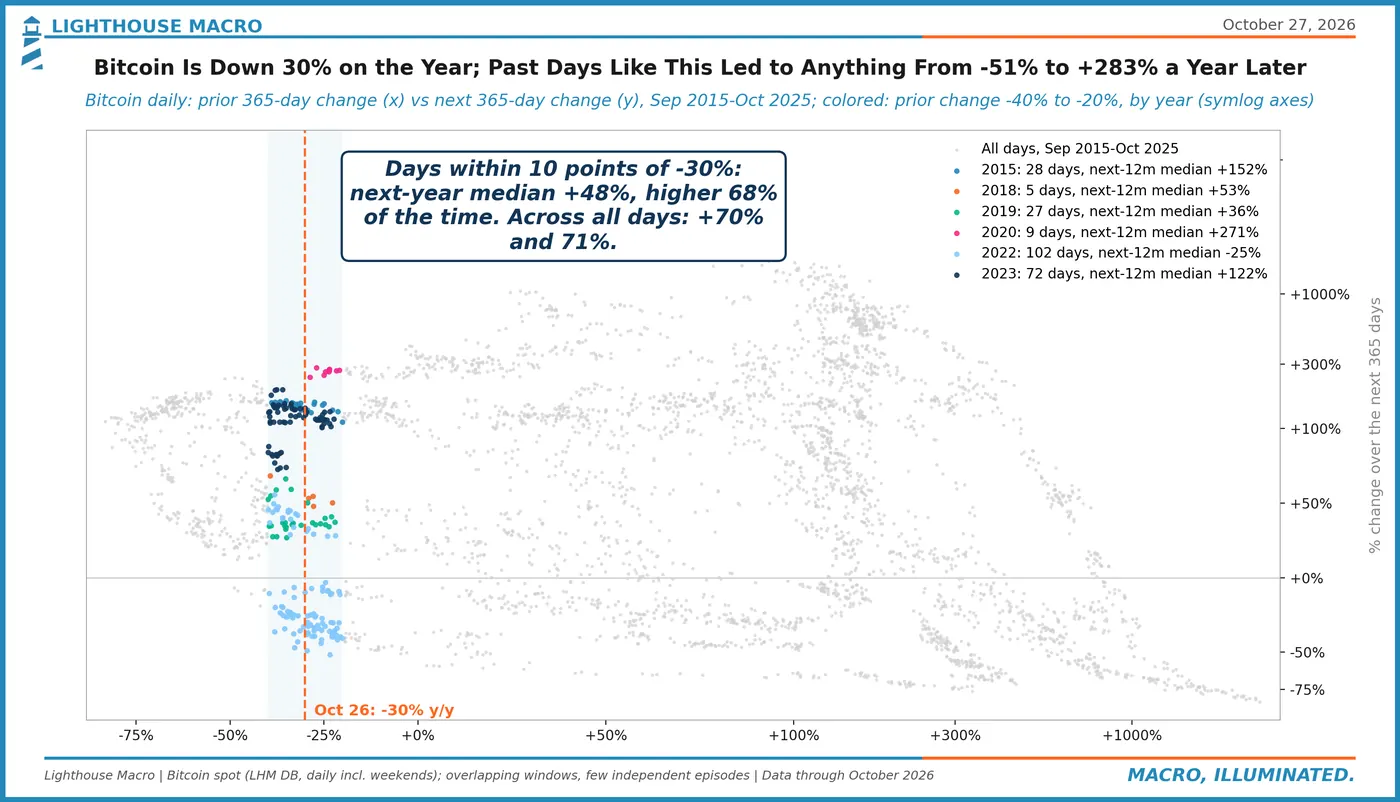
Bitcoin down 30% on the year has meant almost anything next. Past days near this drawdown saw a median +48% over the following year, higher 68% of the time, but the range runs from -51% to +283%, and 2022 is the warning. The episodes overlap heavily.